Development of High Performance Computing Codes in Direct Boundary Element Method Using Hybrid Method Combined with CPU and GPU
‡ Recommended by Editor Won Ju Jeon
© The Korean Society for Noise and Vibration Engineering
Abstract
Various techniques have been proposed to shorten the analysis time of the traditional acoustic direct boundary element method. The overall analysis time can be reduced by vector operations and parallel operations. When constructing the system equation, unnecessary repetitions were reduced and modified separately to increase the analysis speed. To solve the system equations, computation speeds for each case to run on a CPU were compared using LINPACK-, LAPACK-, and MKL-dedicated libraries. Furthermore, when the system equations were solved by hybrid programming using the CPU and GPU, results that were hundreds of times faster could be achieved than when using multiple CPUs. The system matrix had a complex, asymmetric, dense matrix form; thus, direct solution methods were used. A system matrix equation solver code written by the hybrid method using Fortran and C languages was executed in the CUDA core of the GPU, enabling high-speed operations. The prediction results of the input acoustic impedance of a cone horn using the developed direct boundary element method code were in good agreement with the test results. It was possible to perform an acoustic analysis of several thousand degrees of freedom using the developed acoustic direct boundary element method codes at the time of a cup of tea. When using the acoustic boundary element method codes for calculations over 20,000 degrees of freedom and at 200 frequency points, results could be obtained within a few hours.
초록
전통적인 음향 직접 경계 요소법에서 해석 시간을 단축하려는 여러 가지 방법들을 시도하였다. 벡터 연산, 병렬 연산 등을 통하여 전체적인 해석 시간을 줄일 수 있었다. 시스템 방정식을 구성할 때에 불필요하게 반복되는 부분을 별도로 처리하여 해석 속도를 증가시켰다. 시스템 방정식의 해를 구하기 위해 CPU에서 실행하도록 LINPACK, LAPACK 그리고 MKL 전용 라이브러리를 사용하여 각각의 경우에 대한 계산속도를 비교하였다. 또한, CPU와 GPU를 사용하는 혼성 프로그래밍을 하여 시스템 방정식의 해를 구할 때에 기존의 다중 CPU를 사용한 경우보다 수백 배 이상 빠른 결과를 얻을 수 있었다. 시스템 행렬이 복소, 비대칭 그리고 꽉찬 행렬형태를 갖고 있어서 직접 해법을 사용하였다. 포트란 언어와 C 언어를 사용하여 혼성으로 작성된 시스템 행렬 방정식 해법을 GPU의 CUDA 코어에서 실행시켜 고속 연산을 할 수 있었다. 개발한 직접 경계 요소법 코드를 사용하여 콘 혼의 입력 음향 임피던스를 예측한 결과는 시험결과와 잘 일치함을 나타냈다. 개발한 음향 직접 경계 요소법 프로그램을 사용하면 차 한잔 마실 시간에 수천 자유도의 음향 해석이 가능하다. 20,000 자유도 이상 그리고 200개 주파수 점에서 계산하는 음향 경계요소 문제들도 수 시간 내에 가능함을 나타냈다.
Keywords:
Acoustic Boundary Element Method, BLAS, Basic Linear Algebra Subprograms, CUDA, Compute Unified Device Architecture, CuBLAS, Linear Algebra Package, LINPACK, Graphics Processing Unit, GPU, LAPACK, Vector Processing, Open Accelerators, OpenACC, OpenBEM, OpenMP, Open Multi-processing, Parallel Processing키워드:
음향 경계 요소법, 기본 선형 대수 부프로그램, 선형 대수 패키지, 그래픽 연산 장치, 벡터 연산, 개방형 가속기, 개방형 경계요소법, 개방형 다중 연산, 병렬 연산1. Introduction
Park(1) analyzed a loudspeaker enclosure system with 1,786 boundary element(BE)s and 1,609 nodes using a commercial acoustic boundary element method (BEM) program in 2005. In conventional direct BEM, the coefficient matrix of the system equation is dense, asymmetric, and requires a large amount of computation. Acoustic analysis was performed at 29 center frequency points in the 1/3 octave band center frequency between 31.5Hz and 20000Hz. The analysis time for one frequency point was 12 hours and 50 minutes, which took 15 days to obtain the acoustic response curve of the loudspeaker enclosure at all 29 frequency points. In order to reduce the number of boundary elements to be used for acoustic modeling, the loudspeaker part was modeled so that the maximum side length of the boundary element was 0.7 cm, but the enclosure part had a maximum side length of 10cm. When applying the 1/6 wavelength rule, only the analysis result was meaningful up to 8000Hz with respect to the loudspeaker and below 600Hz with respect to the enclosure. Thus, the acoustic response characteristics of the loudspeaker enclosure system were in no good agreements with the test results. Rather, LEAP® software showed in good agreements with the test results. LEAP® required input data like as the loudspeaker’s Thiele-Small parameters, enclosure’s internal and external dimensions, absorption materials types and its filling ratio, and the location of the speakers in the enclosure. If the maximum element length of the enclosure could be modeled to be less than 0.7cm so that the upper frequency limit was up to 8000Hz, it could be assumed that the predicted results of the acoustic response characteristics could be accurate ones compared to test ones. However, it could not be analyzed due to excessive computation time according to an increase in the number of boundary elements. To analyze the acoustic response of the loudspeakers used for home audio, microphones mounted on the mobile phone, and the head acoustic transfer function, it should be analyzed with the analysis frequency range of 400Hz ~ 20000Hz and 100frequency points ~ 200 frequency points. Therefore, the number of boundary elements necessary for BE modeling also needed from several thousands to tens of thousands. The calculation ability of PC (personal computer) used was considered impossible to perform acoustic analysis with BEM at that time. In 2013, Kirkup(2) analyzed the input acoustic impedance of a rectangular shape acoustic horn used in a PA (public address) array using a three-dimensional acoustic BEM. Using the acoustic BEM program(2,3) developed by himself, he reported that the number of elements used was 2189 and the analysis time per one frequency point was 23 min. In 2014 Park et al.(4), to obtain the input acoustic impedance of the conical horn, they made the acoustic impedance head using the piezo exciter proposed by Benade. This device was used to measure the sound pressure simultaneously from two microphones. The input acoustic impedance of the conical horn was derived by a signal processing technique using the wave decomposition theory proposed by Seybert et al. The larger the cone angle, the more accurately the input acoustic impedance was predicted by the Leach method than the Lemaitre theory or the modified Lemaitre formula. The input acoustic impedance of the conical horn was estimated using the Leach method. At that time, the input acoustic impedance of the horn was not analyzed by using acoustic BEM. Recently, Vicente(5) performed acoustic analysis of a microphone with openBEM® operated on MATLAB®. The number of boundary elements used was reported about 2000 and the calculation time was about one hour per frequency point. In this papers, we described methods for improving the speed of acoustic analysis in a conventional acoustic direct BEM codes and the usefulness of a high speed acoustic direct BEM program developed(6,7).
2. Comparison of Analysis Time for Matrix Multiplication
2.1 Vector Processing Method
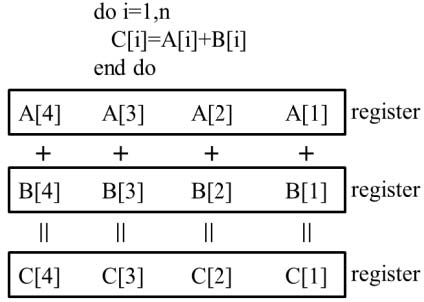
In a computer architecture, one arithmetic operation is executed with one instruction, which is called a single instruction single data (SISD)(8). When the length of the register in the CPU is longer than the data length, multiple operations can be performed in one instruction word at a time and this is referred to as SIMD (single instruction multiple data). The SIMD technique is called vector processing. Fig. 1 shows the flow of general vector processing(7,8). For example, if the length of single precision real data is 4 bytes, data length is 32 bits and the length of the register to be computed is 128 bits, then four real operations are performed at once in one SIMD instruction. Theoretically, SIMD vector computation is four times faster than SISD computation in this case. Depending on the FORTRAN compiler options, it is possible to perform vector operations and speed up the analysis(7).
2.2 Parallel Processing Method
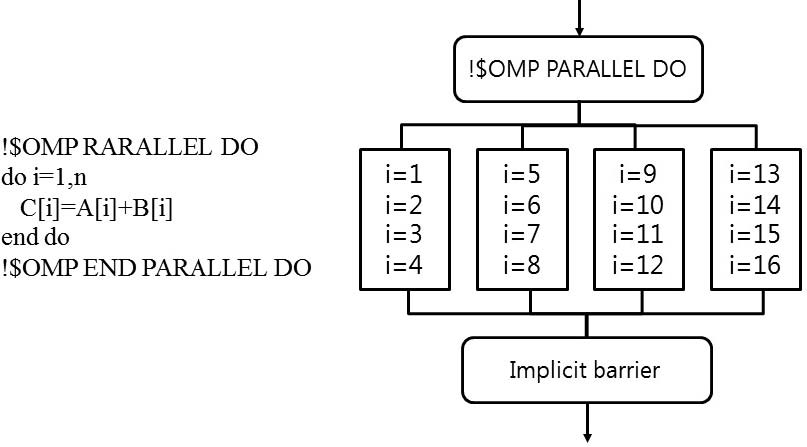
Parallel operation is a technique that uses several CPU cores in the CPU at the same time. OpenMP (open multi-processing) directives can be used to perform parallel operations on multiple cores mounted on a PC. Fig. 2 shows a fork-join model that is a parallel computing method(8). OpenMP directives are used to perform parallel operations on a particular interval in program. When the master thread performs sequential operations and then encounters the openMP directive, threads are created in that portion and parallel operations are performed. At the end of the openMP directive, the previously created threads are automatically destroyed(7,8).
Fig. 3 shows a simplified code and flow diagram for obtaining a matrix sum using four CPU cores.
2.3 Calculation with GPU Accelerator
In multiple CPU cores, it can write codes to perform parallel operations using the openMP directive. The latest multi-CPUs are equipped with 20 cores per CPU(9). On the other hand, parallel processing can be done with the openACC (open accelerators) directive in the graphics processing unit (GPU) on the graphics card, and it is executed in the compute unified device architecture(CUDA) cores(10).
The latest graphics card NVIDIA® TITAN X based on Pascal architecture has 3840 CUDA cores and 384 bits. Therefore, even if the performance of the CPU core is superior to that of the GPU core, the GPU operation method can be faster than the CPU operation method as a whole.
2.4 Calculation Using FORTRAN Library
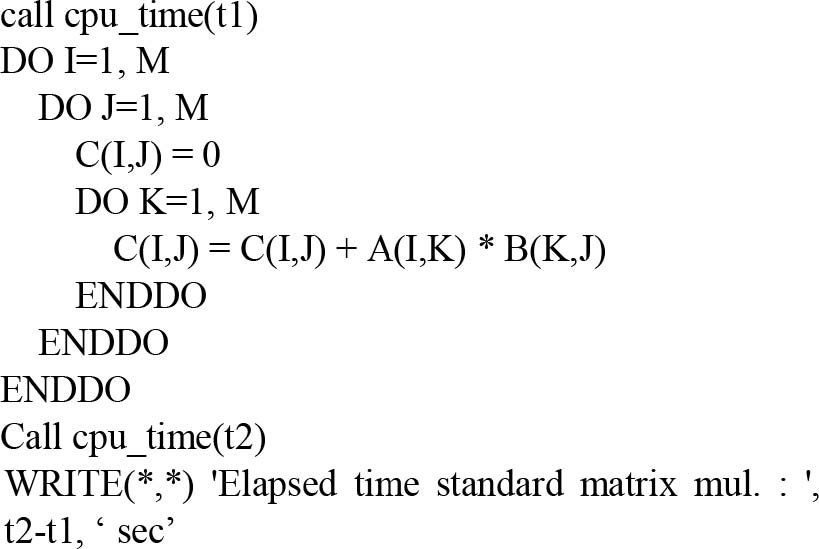
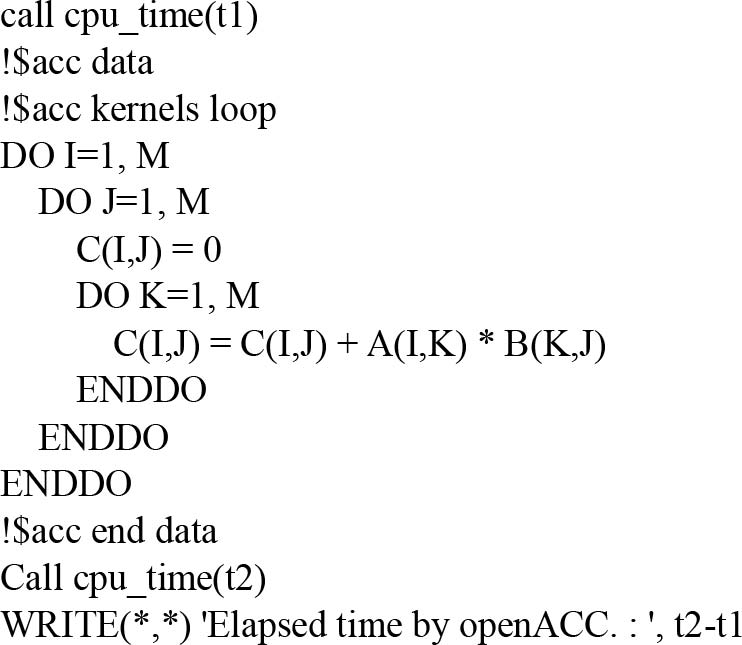
LINPACK (linear algebra package) is a FORTRAN library developed by Jack Dongarra et al.(11) in 1970. LINPACK computes basic vector and matrix operations using the basic linear algebra subprograms (BLAS) library. LINPACK is further developed by using LAPACK (linear algebra package)(12) to order to use CPU cache efficiently. PGI® FORTRAN provides the BLAS library and CuBLAS library using CUDA, and Intel® Parallel Studio XE (Intel FORTRAN) provides the MKL library. The computation times were compared by performing two matrix multiplication expressions (1) using the methods described in Section 2.1 to 2.4. Fig. 4 shows matrix operation codes and some of the time measurement codes.
| (1) |
Here, the matrices A, B and C are square matrices each having a size of m×m.
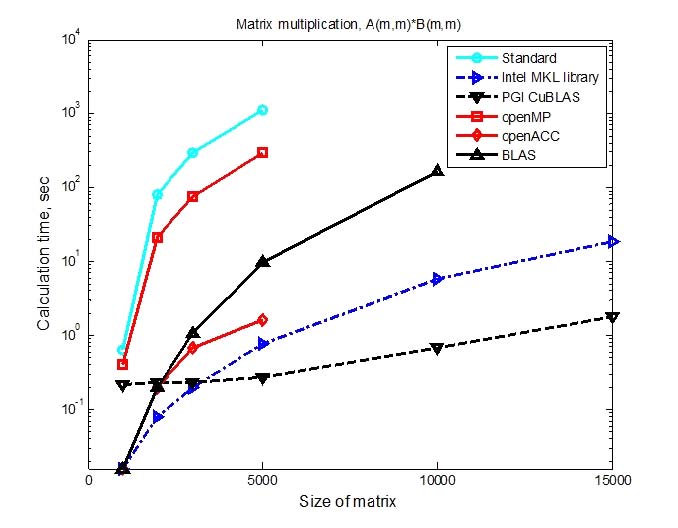
In Fig. 5, The matrix multiplication calculation times according to matrix sizes were compared. The PC specification used was Intel® i7 4790K@4.0GHz, 32GB RAM and the operating system was Windows 7 64bit. PGI® FORTRAN compiler was used. In Fig. 5, standard means that the code in Fig. 4 was used. This result was obtained by using compiled executable file without options of vector and parallel operations. OpenMP shown in Fig. 5 was the result by using compiling and executing the code that contained the code that declared the openMP directive shown in Fig. 3 to be allocated before and after DO LOOP in Fig. 4. BLAS in Fig. 5 meant that a BLAS level 3 function “sgemn” performed a matrix×matrix operation instead of the code in DO LOOP in Fig. 4 and compiling with BLAS library when compiling with PGI® FORTRAN. OpenACC in Fig. 5 meant that the GPU-accelerated codes in Fig. 6 using openACC directives were used instead codes of Fig. 4. Intel MKL library meant the same code as BLAS in PGI® FORTRAN compiler. And it showed computing time results from a hybrid compilation of a mix of Intel® FORTRAN MKL libraries instead of PGI® FORTRAN’s BLAS library when compiling with PGI® FORTRAN. PGI CuBLAS, which showed the fastest calculation time when the matrix size was more than 5000, used the CUDA function “CuBLASsgemm” instead of the codes in DO LOOP of Fig. 4. This was the result of compiling and linking with the cusolver library in PGI® FORTRAN. In Fig. 5, the calculation time of the matrix multiplication 5000×5000 using the CUDA GPU, PGI CuBLAS, was 0.27sec, and the time calculated by the CPU as the standard was 1117.2sec, which was 4138 times faster than standard.
The matrix multiplication calculation time of 3000×3000 or less was shorter than that of PGI® CuBLAS. The reason for this was that when using PGI® CuBLAS, it involved transferring CPU RAM data to GPU RAM and then calculating in GPU RAM and transferring results back to CPU RAM. Thus, Intel MKL library was effective when matrix size was small or computation time was short.
3. Time Ratio Analysis of Traditional Direct BEM Analysis Parts
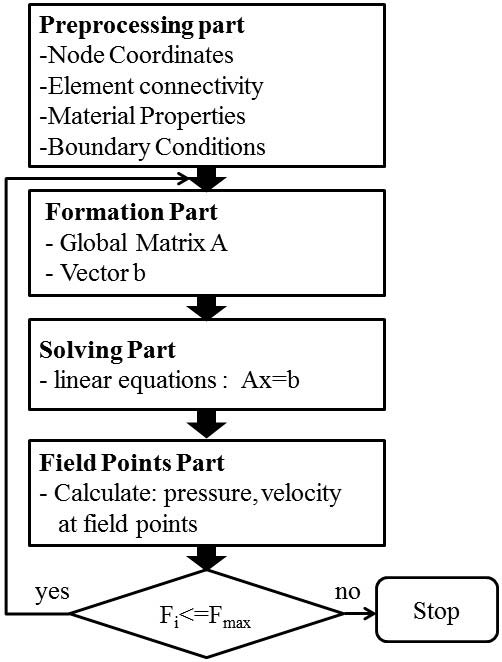
As mentioned in Section 1, acoustic direct BEM had a disadvantage of long analysis time. In order to shorten the analysis time, it was necessary to find the time ratio at which each part of the acoustic BEM code contributed to the analysis. It was possible to shorten the overall analysis time by improving the component with the longest analysis time. The BEM codes proposed in this papers were based on the direct BEM codes proposed by Wu(13). The acoustic BEM analysis process could be divided into four parts. Fig. 7 showed a flow chart of a conventional acoustic BEM. (1) preprocessing part of input data, (2) formation part that constructs a global coefficient matrix A from element coefficient vectors and a right-hand side vector b, (3) solving part to solve the system of equation, (4) field points part that calculates the sound pressure at arbitrary field points in space, and so on. The short cone horn was modeled to estimate the calculation time at each part. The length of the short cone horn was 136mm, the throat diameter was 18mm, the mouth diameter was 90mm, the cone angle was 27.9˚, and the thickness was 5mm(4). PC used was called PC1, Intel Core2 Duo T7200@2 GHz, 2GB RAM with Windows XP with 32bit. A program compiled BEM codes presented by Wu(13) was called Ver0, which was executed on PC1. The calculation time of each part according to the number of boundary elements used for short cone horn modeling was shown in Fig. 8, respectively.
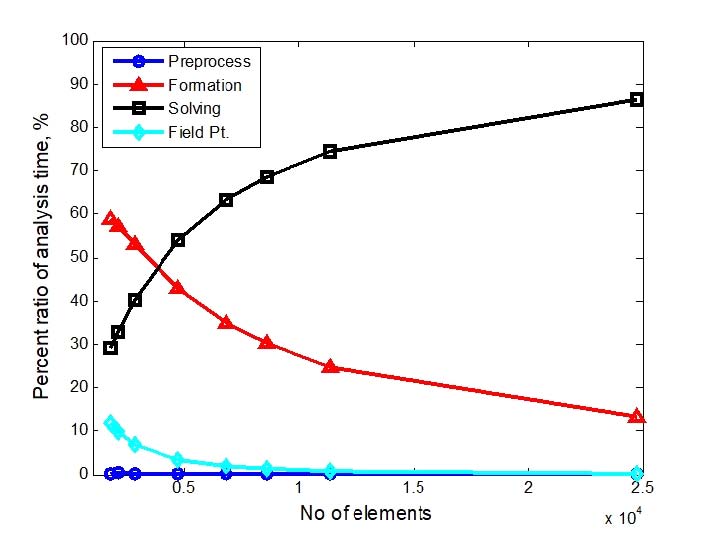
Percent ratio of analysis time according to numbers of element for short cone horn performed on Intel Core2 Duo T7200@2 GHz, 2 GB RAM with Windows XP with 32 bit, based on Ver0
In Fig. 8, formation (marker: Δ) and solving part (marker: □) took up most of the computation time. When the number of boundary elements used in the modeling of cone horn was larger than 4736, the solving part dominated more than 50%. Therefore, in order to shorten the calculation time in the conventional direct BEM analysis, it was firstly necessary to lower the calculation time of the solving part.
4. Procedures of High Performance Computing in Traditional Direct BEM
In this papers, we developed and improved traditional acoustic direct BEM codes by changing the method of solving the system equation to improve the speed of calculation of the solving part. And also it was suggested the method to modify or omit the loop part which was unnecessarily repeated in the formation part.
4.1 Calculation Speed Improvement in Solving Part
The comparisons of the computation time of the solving part of the developed acoustic BEM program were shown in Fig. 9 and Table 1, respectively. Table 1 showed the calculation time of the solving part according to the number of elements. The object to be analyzed was the short cone horn described in Section 3. The reason why the x-axis was the number of nodes instead of the number of elements was that the degree of freedom of the system equation of BEM was equal to the number of nodes. In order to implement high speed operation and improve memory limit, it was changed the PC from Intel® CoreTM 2 Duo T7200 with Windows XP to Intel® i7 4790K@4GHz 32GB with Windows 7 Enterprise K based on 64bit equipped with a GTX 980 GPU card. The following four cases were applied to the solver of the system equation.
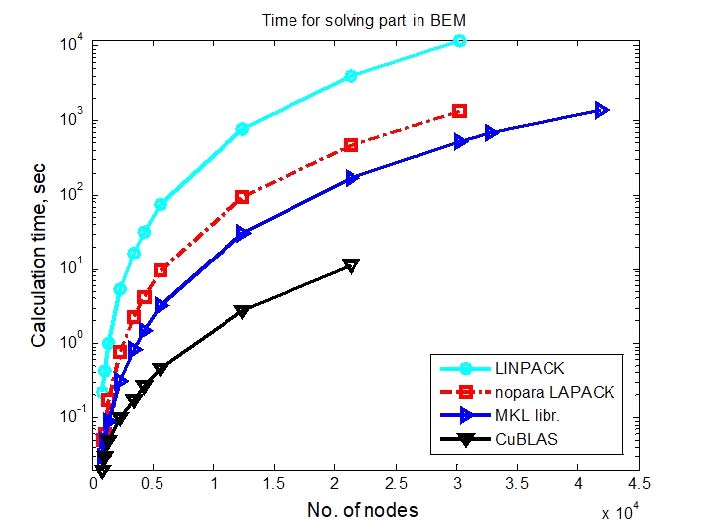
Comparison of calculation time of solving part of BEM according to numbers of node performed on Intel i7 4790K@4 GHz, 32 GB RAM and GTX 980 with Windows 7 with 64 bit

Comparison of calculation time of solving part for cone horn according to no. of elements(unit: sec)
(1) LINPACK: using QR factorization subroutines in LINPACK as solver of system equation in BEM codes, and compiled and linked by PGI® FORTRAN compiler, without vector and parallel processing, calculated using CPU only, Ver1
(2) nopara LAPACK: using QR factorization subroutines in LAPACK as solver of system equation in BEM codes, and compiled and linked by PGI® FORTRAN compiler, without vector and parallel processing, calculated using CPU only, Ver2
(3) MKL libr: application of hybrid compiling method that Intel® Fortran MKL library with QR factorization subroutine in LAPACK were compiled and linked by PGI® FORTRAN compiler with options of parallel processing, calculation using CPU only. It was called Ver3
(4) CuBLAS: QR factorization subroutines, CuSolver library in LAPACK optimized for CUDA was used as a solver in solving part in BEM codes. We utilized CUDA functions to compute in GPU CUDA, but these codes were composed of hundreds of lines of code involved to solve system matrix equation problems with a good combination of these functions. Fortran and C language interface routines were included in the direct BEM code so that C libraries that contained routines for parallel computation using pointers within the GPU using CUDA C code could be used in Fortran codes. It included codes that used Fortran language to perform functions such as data transfer, copying, etc., using various functions that allowed CUDA to process them in parallel. These developed codes were compiled and linked by Intel® Fortran compiler to include Intel® Fortran library and PGI® Fortran library and CUDA C library with the help of pgi_mkl_thread library. It was used to calculate system matrix equation using GPU CUDA only, Ver4.
In Fig. 9, the number of nodes 12366 corresponded to the number of elements 24728. The calculation time was 772.10sec for Ver1, 93.09sec for Ver2, 31.00sec for Ver3 and 2.75sec for Ver4, respectively. If time ratio was based on CuBLAS, it showed Ver1:Ver2:Ver3:Ver4=281:34:11:1. In other words, in BEM solving part, using the BEM codes developed on GPU combined with CuBLAS library as a solving part, the computation speed for the number of nodes 12366 case showed 281 times faster than using the BEM code proposed by Wu(13). In Ver0, the program proposed by Wu(13) was executed on PC1, computing time was 24138sec, and Ver4 with CuBLAS on Intel i7 4790K showed 8777 times faster than in PC1.
This fast calculation speed was due to the fact that the Windows XP 32bit 2 CPU core operation was replaced to the i7 4790K Windows 7 64bit operation and graphic card GTX 980 Maxwell architecture 256 bit and 2048 CUDA cores, which was a combined effect of speed enhancement. When the number of boundary elements was 2146, Kirkup:Ver0:Ver4= 1380:16.17:0.03=46000:539:1 was obtained in comparison to the analysis result of Kirkup(2) mentioned in Section 1. In other words, comparing the computation speeds simply ignoring the performance difference of the used PC, Ver4 of CuBLAS showed 46000 times faster than Kirkup’s analysis. The results of calculating time ratio of BEM analysis in Ver4 using CuBLAS were shown in Fig. 10.
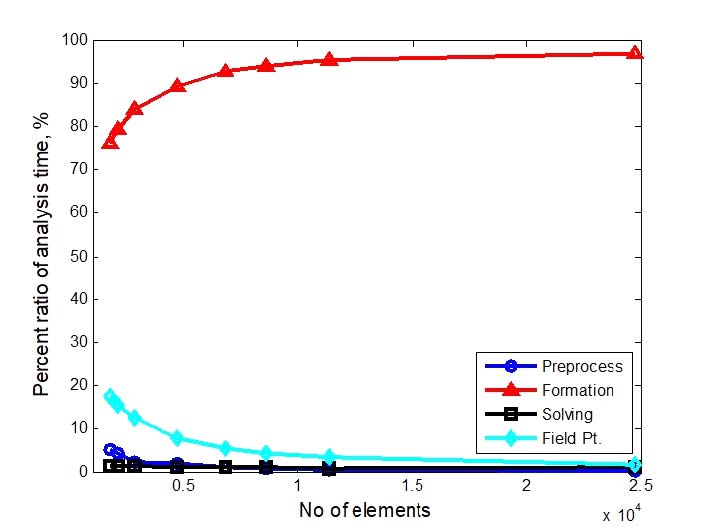
Percent ratio of analysis time according to numbers of element for short cone horn Intel i7 4790K@4 GHz, 32 GB RAM and GTX 980 with Windows 7 with 64 bit, based on Ver4
The proportion of the solving part in Fig. 8 increased as the number of elements increased, which was 86.5% when the number of elements was 24728, but decreased to 1.14% in the case of Fig. 10 using the Ver4 program which improved the solving part. Instead, the formation part was shown in Fig. 8 and Fig. 10, from 13.4% to 97.08%, respectively. Therefore, it was necessary to reduce the calculation time of the entire BEM analysis by increasing the calculation speed of the formation part.
4.2 Calculation Speed Improvement in Formation Part
In Fig. 7, the global system matrix A was constructed from element coefficient vectors(13). In this process, the collocation method was applied to the surface Helmholtz integral equation and the boundary integral method was applied to the boundary element method by discretization. In calculating the coefficient vectors, Wu(13) used the singularity subroutine to calculate the element coefficient vectors using the connectivity information of the elements for all element numbers if any nodes in the outer loop was equal to node inside of element in inner loop. In this papers, the computation time in the formation part was reduced by checking the singularity in advance and eliminating the unnecessary repetitive calculation of the element coefficient vectors using this data. More details on this may be covered in subsequent articles. The formation part was improved and was called as Ver5. The ratio of calculation time of each part according to the number of boundary elements was shown in Fig. 11, respectively. When the number of elements was 24718, the proportion of formation part was improved from 97.08% to 85.50%.
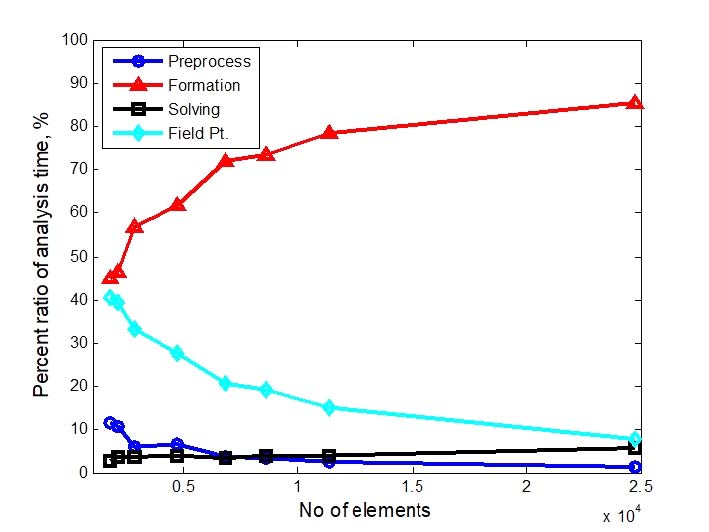
Percent ratio of analysis time according to numbers of element for short cone horn Intel i7 4790K@4 GHz, 32 GB RAM and GTX 980 with Windows 7 with 64 bit, based on Ver5
The input acoustic impedance was calculated by applying a conventional acoustic direct BEM to a short cone horn. Table 2 showed the total analysis time according to the number of elements. The whole BEM analysis time showed 20 times faster than initial BEM by enhancement of both the solving and formation part of the initial BEM program (Ver1) using LINPACK suggested by Wu. In addition, Ver5 showed totally 572 times faster than Ver0 with Intel® Core2 Duo T7200 PC. It may be further reduced the computation time by using GPU programming with openAcc or CUDA FORTRAN. It may be topics to be studied in the future.
5. Acoustic Analysis for Short Cone Horn
A short cone horn was analyzed using the developed acoustic direct BEM program. In order to utilize the preprocessing and postprocessing programs combined with BEM codes, Helm3D program given by Morgans(14) was modified. Also, the developed BEM codes have been modified to be able to be executed with preprocessing and postprocessing software. Postprocessing codes that ran in MATLAB® or OCTAVE® were also developed. In direct BEM analysis, non-uniqueness difficulty occurs when analyzing external acoustic problems. The Schenck method(15) (or CHIEF, combined Helmholtz integral equations formulation) has known as a simple solution to this problem. In this papers, the non-uniqueness problem was solved by the Schenck method(15) in the external sound field analysis. In other words, when solving the external acoustical field problem, we set the CHIEF points in the internal field to zero pressure condition as the constraints to the surface Helmholtz integral equation(13). Therefore, the system equation became an over-determined system which number of given equations were greater than the unknown vector, and the solution was solved by the QR decomposition method. To evaluate the performance of the developed BEM codes, the computational performance was compared by calculating the input acoustic impedance of the cone horn, which was similar to that of Kirkup’s(2) analysis. Set CHIEF points values be 2, and the number of field points was 181 for calculation in the external field pressure. The size of the global matrix of the solving part became A(m, n) and m=n+CHIEF points, so the solving part must be solved by over-determined equations. The solution was obtained by the least square method using QR factorization, a direct solution method. The object to be analyzed was the short cone horn(4) described in Section 3. Table 3 showed the analysis cases for the cone horn.

Simulation model for cone horn, length 136mm, throat diameter 18mm, mouth diameter 90mm, cone angle 27.9˚, thickness 5mm
Dmax represented the length of the longest side of the element in boundary element modeling. The Neumann boundary condition was applied to the throat area as a velocity boundary condition of 1m/s. The input acoustic impedance(4) was the result of the sound pressure obtained at the closest position divided by the volume velocity, which was the throat normal velocity×throat area. Fig. 12 showed model Ex4 meshed using a triangular isoparametric boundary element. Fig. 13 showed the sound pressure distribution on the surface of the short cone horn where the number of elements 6854 and the number of nodes 3429 was analyzed at frequency 5218Hz.
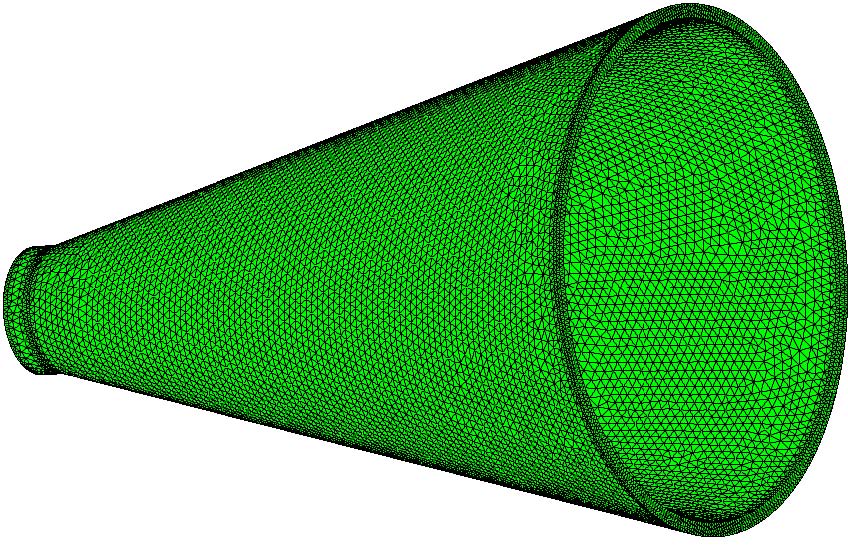
Boundary element modeling of short cone horn, 21 287 nodes model, Neumann B.C. velocity, 1 m/s at throat surface
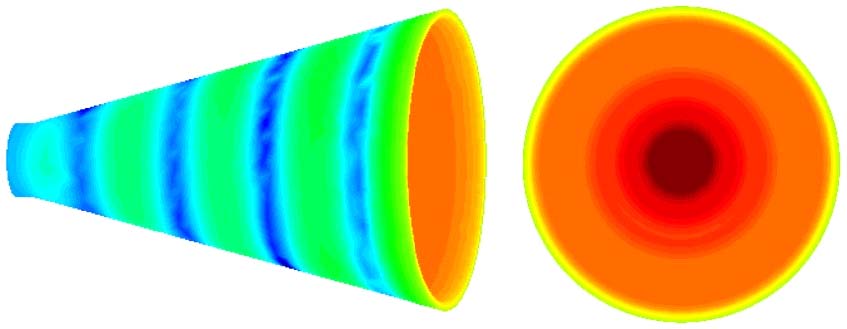
Pressure contour on surface for short cone horn, frequency: 5218 Hz, 3429 nodes model, Neumann B.C. velocity = 1 m/s at throat surface
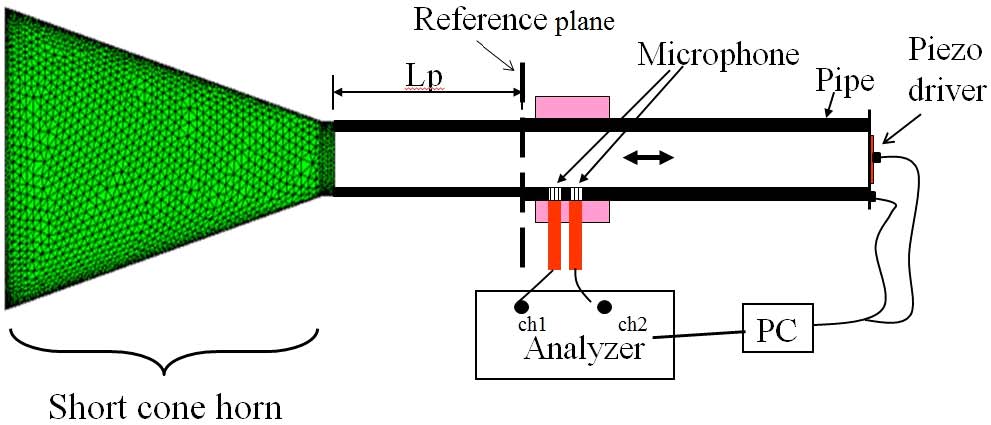
Using these surface sound pressure results, the sound pressure in a certain field points could be calculated at the field point part. Fig. 14 showed a device for measuring the input acoustic impedance for the short cone horn used in reference[4].
Impedance heads were fabricated by using piezo excited elements in the same manner as Benade et al. as measuring instruments to measure input acoustic impedance. This exciter was used to generate a random sound on cone horn. Since the inner diameter of the corn horn was 18mm, one end of the tube with an inner diameter of 18mm was connected to the throat of the cone horn and the mouth part of the cone horn was left under free air. A piezo exciter was installed at the end of the tube, and a piezo exciter was driven using a signal filtered with a lowpass digital filter applied to the random signal so that the maximum frequency of the piezo exciter was 10kHz. Two 1/4 inch microphones were mounted near the middle of the tube to simultaneously measure the sound pressure inside the tube. The calculated test data was the result of the input acoustic impedance derived by the signal processing method according to the wave decomposition theory proposed by Seybert, as shown by the solid line in Fig. 15.
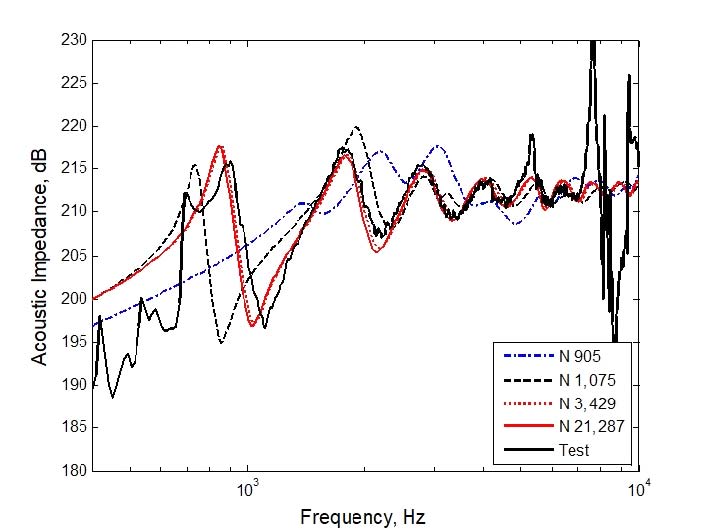
Comparison of input acoustic impedance of short cone horn, blue dash-dot: 905 nodes model, black dashed: 1075 nodes model, red-dotted: 3429 nodes model, red-solid: 21 287 nodes model, blacksolid: test result
However, the Seybert theory was a theory that could be applied in plane wave conditions. Since the diameter of the tube was 18mm, the tube acoustic wave mode occurred at 9528Hz or higher, and the condition of the plane wave in the tube was broken. Therefore, the test result was unreliable at frequencies higher than 9528Hz. In addition, since the critical frequency according to the two microphones intervals was 9270Hz, test results could be relied on only lower than 9270Hz with the test equipment manufactured. Below 1000Hz, the acoustic exciter was not nearly excited at frequency due to the characteristics of the piezo exciter. On the other hand, the test was conducted in a laboratory that was not a completely anechoic chamber, but the result of the input acoustic impedance test obtained by signal processing of the sound pressure data obtained from two microphones obtained in the low frequency region due to the background noise in the laboratory was unreliable. Beyond 7000Hz, the test results derived from the very small acoustic input signal of the piezo exciter and due to the high frequency limit due to the high frequency mode and microphone spacing in the tube showed no meaningful test results. Therefore, only the test results (solid lines) in the range between 1000Hz and 7000Hz in Fig. 15 were meaningful values. Fig. 15 compared the BEM results with the input acoustic impedance (black solid line) obtained by test(4). In Fig. 15, Ex1 model (blue dash-dot) showed a completely different shape from the test result (black solid). In the case of Ex2 (black-dash), the shape was somewhat similar to the test result. According to the 1/6 wavelength rule, Ex1 or Ex2 should give accurate results at frequencies below 1874Hz. Also, Ex1 ~ Ex4 were expected to have similar acoustic patterns below this frequency range. But, Ex1 and Ex2 showed patterns different from Ex3 or Ex4. The reason for this was as followed. The BEM model of cone horn had a cone shape with a thickness of about 5mm. For the direct BEM analysis, we modeled the surface of the cone horn to surround it. Then, an external sound field analysis was performed. This modeling was like a shape modeled on a jar or coffee cup. The bottom of the coffee cup became the throat surface of cone horn modeling. The result of dividing the sound pressure near the interior floor of the coffee mug by the volume velocity inside the coffee mug was input acoustic impedance, when the floor surface of the coffee mug vibrated at a constant speed in the frequency range of interest and the outer floor and other surfaces of the coffee mug were stationary. However, in this modeling, when the size of the facing acoustic elements located inside and outside of the coffee cup having a thickness of 5mm was larger than the thickness of the coffee cup, the distance between the facing acoustic elements was too close comparing to the acoustic element size, singularity problems occurred. Therefore, to resolve these singularity problems, the size of the element should be smaller than the theoretical values. In case of Ex1 or Ex2, it was predicted that the analytical results did not agree well with the test results because the size of the coffee cup, ie, the element size, was significantly larger than the coffee cup thickness. In other words, in the BEM analysis, not only the size of the element but also the distance of the facing element affected the accuracy of the analysis. Therefore, it was predicted that Ex1 and Ex2 did not agree with the test results. Ex3 (3429 nodes, red-dotted) showed good agreements with the test results. BEM analysis results showed better coincident with test results than Leach’s method(4). Model Ex4 was similar to that of 3429 nodes model Ex3. Thus, it was not necessary to model the cone horn more finely than Ex3. Fig. 16 showed the sound pressure at a distance of 1m from the center of throat of the cone horn, which was from the on-axis response(0˚) to the off-axis acoustic responses (45˚ ~ 180˚).
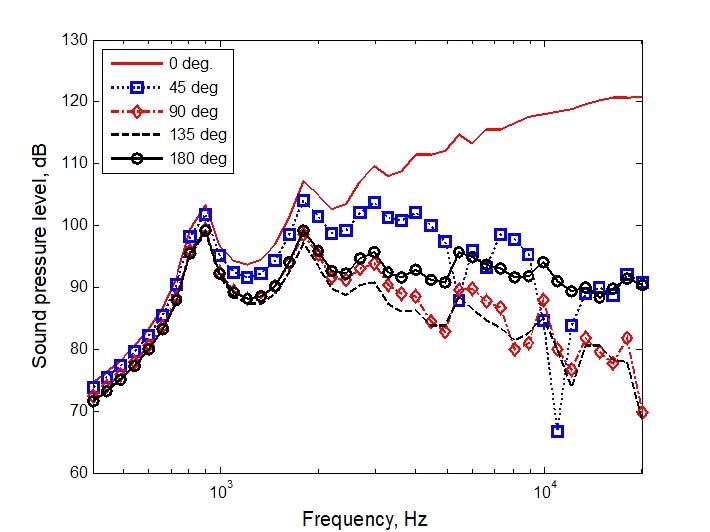
Sound pressure level according to off-axis for short cone horn, frequency range: 400 Hz ~ 20 000 Hz, 3429 nodes model, Neumann B.C. velocity = 1 m/s at throat surface
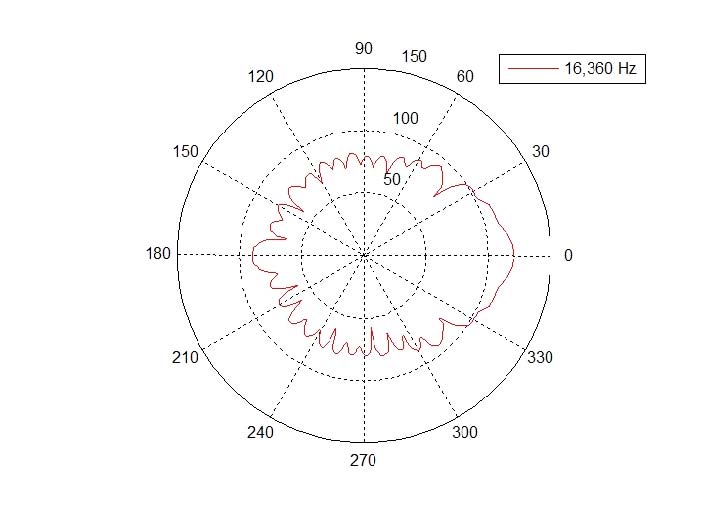
Throat surface on model Ex3 was excited with a constant speed of 1m/s on. Fig. 16 showed the result obtained from the sound pressure calculated at the field points in the far field point part. When the throat part vibrated at a constant speed 1m/s over the entire frequency range, the sound pressure at 180˚ off-axis showed the most flat shape. The sound pressure measured at 45 degrees showed a significant reduction in sound pressure at 10960Hz. The reason was that the sound radiation pattern at 10960Hz (Fig. 17) showed dip due to acoustic radiation characteristics at 45 degrees. In this Section, 361 field points was used to calculate sound pressure levels at field points, which one point was the nearest point at the throat center and points on the circle with radius 1m centered at throat area center was divided by 1˚ step. Fig. 18 showed the acoustic radiation directivity pattern of the short cone horn calculated using the sound pressure data calculated at 360 field points for 16360Hz. A postprocessing program written in MATLAB® language was used to plot directivity pattern.
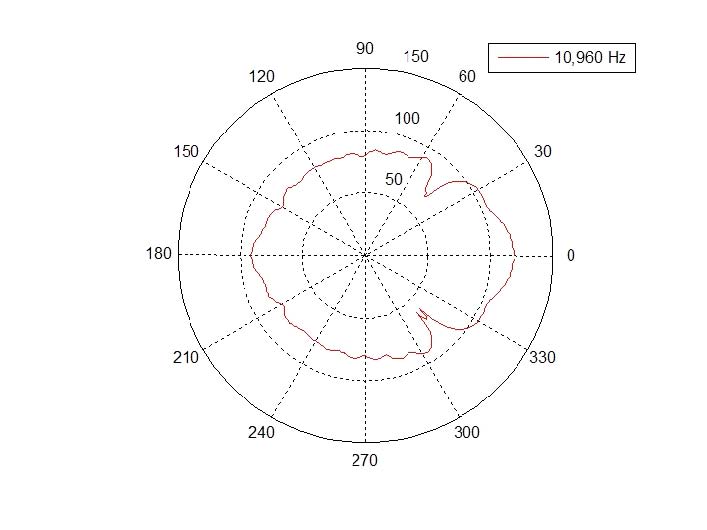
Directivity pattern at 10 960 Hz for short cone horn, 3429 nodes model, 0 means on-axis, from throat to mouth, and it shows dip at 45˚.
6. Conclusions
High performance acoustic direct BEM was suggested from a traditional acoustic direct BEM program using a hybrid method combined CPU and GPU libraries. When the input acoustic impedance analysis for short cone horn modeled with 21287 nodes was performed, the calculation time was about 300 times faster in the solving part than in the BEM codes using LINPACK library presented by Wu. Ignoring the differences in the computer used, the result was 46000times faster than the Kirkup’s analysis result(2) of the BEM problem with a similar number of elements. Also, when the operation of the unnecessary part of the formation part was improved, the total analysis time was totally 20 times faster than the BEM codes proposed by Wu(13). In the case of one frequency on 24728 elements, the solving part took 2.75 seconds, and the total analysis time was only 48.8 seconds, so it took about 3 hours to calculate the input acoustic impedance of the short cone horn for 200 frequency cases. If data racing problem could be surmounted in the formation part with multi-CPU or GPU operations, faster BEM codes may be suggested in near future. It may be one of the research topics to be tackled in the future. The coefficient matrix of the system equation was dense and asymmetric, so it was solved by using the direct solution method in this papers. Many researchers have been studied the applications to iterative solution methods of BEM. But, it still may be another research fields to estimate effectiveness of iterative methods and direct methods of direct BEM.
Acknowledgments
This papers dealt with the article published at the conference of the Autumn Korean Society for Noise and Vibration Engineering in October, 2016 and the article developed in the journal of the Chungbuk Health and Science University in 2016.
Thanks to Dr. Morgans for providing the Helm3D program that connects CAD program, GID with BEM to enable preprocessing and postprocessing.
References
- Park, S. T., (2005), Enhanced Approach Using Computational and Experimental Method for the Analysis of Loudspeaker System, Journal of the Acoustical Society of Korea, 24(3E), p90-98.
-
Kirkup, S. M., Thompson, A., Kolbrek, B., and Yazdani, J., (2013), Simulation of the Acoustic Field of a Horn Loudspeaker by the Boundary Element-Rayleigh Integral Method, Journal of Computational Acoustics, 21(1), p1250020-1-1250020-17.
[https://doi.org/10.1142/s0218396x12500208]

-
Kirkup, S. M., (1998), The Boundary Element Method in Acoustics, Hebden Bridge, UK, Integrated Sound Software.
[https://doi.org/10.1016/s0218-396x(00)00016-9]

-
Sa, J. S., and Park, S. T., (2014), A Study on the Acoustic Modeling of Horn – Analysis and Design of Acoustic Horn, Transactions of the Korean Society for Noise and Vibration Engineering, 24(7), p537-548.
[https://doi.org/10.5050/ksnve.2014.24.7.537]

- Henríquez, V. C., and Juhl, P. M., (2012), Modelling Measurement Microphones Using BEM with Visco-thermal Losses, Paper presented at Joint-Baltic-Nordic Acoustics Meeting (BNAM2012), June 18th-20th, Odense, Denmark.
- Park, S. T., (2016), Development of High Performance Computing in Boundary Element Method, Proceedings of the KSNVE Annual Autumn Conference, p68.
- Park, S. T., (2016), Development of High Performance Computing in Acoustic Analysis, Journal of Chungbuk Health & Science University, 25, p1-20.
- Bang, E. J., (2014), Intel Visual Fortran User’s Guide, Escomsoft co.
- PassMark® Software, (2019), CPU Benchmarks, http://www.cpubenchmark.net.
- Wikipedia, (2019), OpenAcc, http://en.wikipedia.org/wiki/OpenACC.
- Dongarra, J. J., Bunch, J. R., Moler, C. B., and Stewart, G. W., (1979), LINPACK User’s Guide, Siam, PA, Society for Industrial and Applied Mathematics.
- Wikipedia, (2018), LAPACK, http://ko.wikipedia.org/wiki/LAPACK.
- Wu, T. W., (2000), Boundary Element Acoustics: Fundamentals and Computer Codes, Southampton, UK, WIT Press.
- Morgans, R. C., (2004), Optimisation Techniques for Horn Loaded Loudspeakers, Ph.D Dissertation, The University of Adelaide, South Australia, Australia.
-
Schenck, H. A., (1968), Improved Integral Formulation for Acoustic Radiation Problem, The Journal of Acoustical Society of America, 44(1), p41-58.
[https://doi.org/10.1121/1.1911085]


Seok-Tae Park, B.S. in Hanyang University, Mechanical Eng., 1984., M.S. in KAIST, Mechanical Eng., 1986., Ph.D. in Ajou University, Systems Eng., 1999. 1986 ~ 1989., KAIST (KIST) Mechanical Eng., researcher. 1989 ~ 1992., Ssangyong Motor Co., senior researcher. 1993 ~ 1999., IAE Automotive Technical Lab. principal researcher. 2000 ~ present, in Chungbuk Health & Science University Assistant Professor. His principal interest is the fields of sound quality index codes programming, noise control, and subjective evaluation, loudspeaker, horn and microspeaker system analysis and design, boundary integral analysis in Acoustics.
