Condition Diagnostic of Two-stroke Low-speed Diesel Engine using Acoustic Emission Sensor
© The Korean Society for Noise and Vibration Engineering
Abstract
Currently, condition diagnostic technologies of general machinery and their structures based on an acoustic emission sensor (AES) are widely used and applied to a variety of fields. An AES is an efficacious and powerful tool for measuring the high-frequency vibrations of reciprocating or rotating devices. Data acquisition (DAQ) and analysis software (S/W) for AES operating at high frequencies from 50 kHz to 1 MHz is necessary. In this regard, an S/W has been developed to facilitate the simultaneous monitoring of 12 channels using National Instrument’s (NI) NI6366 DAQ device and C# programming language to achieve a sampling rate of 2 MS/s for each channel. In a case study involving a two-stroke low-speed diesel engine during sea trial, the firing conditions of all the cylinders and the working conditions of the top bracing (TB) were detected. Based on the results, it was demonstrated that the recorded vibrations under normal firing conditions have a larger amplitude than the vibrations that occur under the misfiring conditions, in all investigated operation ranges. In addition, the TB on-off condition was detected by a 1/80 octave analysis of the AES signal via wave transmission. When the mechanical components participate in the moving process, there is the possibility of the generation of friction and wear including deformation and micro-fraction, as well as slipping between moving parts. These results can serve as useful information for the detection of mechanical working conditions in the future.
초록
최근 일반 기계와 관련 구조물에서 음향 방출 센서를(AES) 이용한 상태 진단 기술이 자주 이용되고 있고 응용분야도 다양하다. 특히 AE 센서는 사용주파수가 높기 때문에 모니터링과 분석 소프트웨어(S/W) 개발이 필요하여 개발하였다. 이 연구에서는 미국 National Instrument(NI)사 NI6366과 C# 언어를 이용하여 AES 사용영역인 50 kHz ~ 1000 kHz까지 분석하도록 최대 샘플링속도 2 MS/s, 12채널까지 동시에 사용할 수 있도록 소프트웨어를 개발하였다. 사례 연구로 선박용 저속 2행정 디젤엔진에서 실린더 내 폭발 압력이 크고 피스톤의 왕복운동에 따른 윤활 마찰 등을 고려하여 AES를 실린더 라이너 하단부에 설치하여 웨이브 신호를 취득하였다. 일차적으로 여기서 얻은 신호를 분석한 결과 선박의 주 기관인 저속 2행정 디젤엔진에서 한 실린더 내 착화실패 및 톱 브레이싱의 작동상태를 확인할 수 있었다. 또한 AES 신호는 그 외 실린더와 피스톤사이의 윤활이나 마찰 등의 연구 가능성을 열어주고 있다.
Keywords:
Acoustic Emission Sensor, Condition Diagnostic, Two-stroke Low-speed Diesel Engine키워드:
음향 방출 센서, 상태 진단, 저속 2행정 디젤엔진1. Introduction
The main engine of the propulsion system is the most important part of a ship. It determines the productive capacity and the safety level of the ship in any weather condition at sea. Thus, the engine’s state is a primary concern and all information regarding its operation should be monitored. In particular, the firing state of the cylinder is critical to normal operation. Currently, most diesel engines use pressure and thermal sensors to obtain this information. In this report, a new technique is introduced to evaluate the firing state of a cylinder as well as the engine’s status.
Recently, acoustic emission techniques have been used in a wide range of health monitoring applications. These approaches are commonly used to investigate the state of the components of diesel engines including injectors(1,2), valves(4), piston wear(5), cylinder pressure(1,3), gearboxes(6,8,9), and bearings(7,10,11). In an experiment conducted by Tian Ran Lin on a 4-stroke, 4-cylinder diesel generator engine, various loads were used to determine the fault state of the injectors(1). The investigation of fault detection of injectors was conducted by Ahmad on a 4-stroke, 6-cylinder engine(2) and the applicability of AES for frequencies lower than 50 kHz was demonstrated. AES signals are also used to indirectly determine the pressure in cylinders or the mechanical condition of structures in large 2-stroke low-speed diesel engines, as well as small 4-stroke diesel engines(3). The range of the measured vibration frequency depends on the frequency range of the experimental equipment, for example, 20 kHz(1), 30 kHz(3), or 50 kHz(2).
In this study, an experiment on a large 2-stroke, 6-cylinder marine diesel engine was conducted to investigate the vibrations associated with a diesel engine for frequencies in the range of 50 kHz to 800 kHz for two operation modes.
2. Experimental Overview
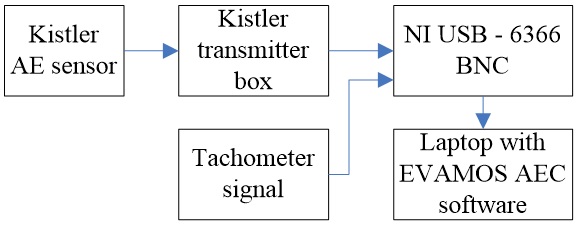
The experimental system consisted of three main blocks; namely, the AES, medium transmitter, and the monitoring and analyzing S/W. This S/W was specially designed to measure high-frequency vibrations. This data was then analyzed and compared with a database to partially determine the state of the diesel engine. The overall block diagram of this system is shown in Fig. 1.
2.1 Acoustic Emission Sensor
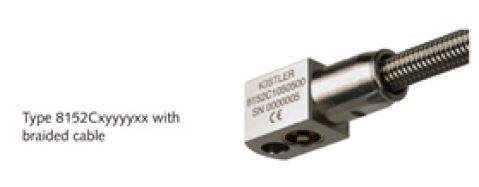
The Kistler AES that was used in the experients consisted of two parts. One component is the sensor that detects high-frequency vibrations, and the other is a transmitter box that converts the vibrations detected by the sensor into voltage or current output signals(12). This AES was able to measure vibrations in the frequency range of 50 kHz to 1 MHz with high sensitivity, and is displayed in Fig. 2.
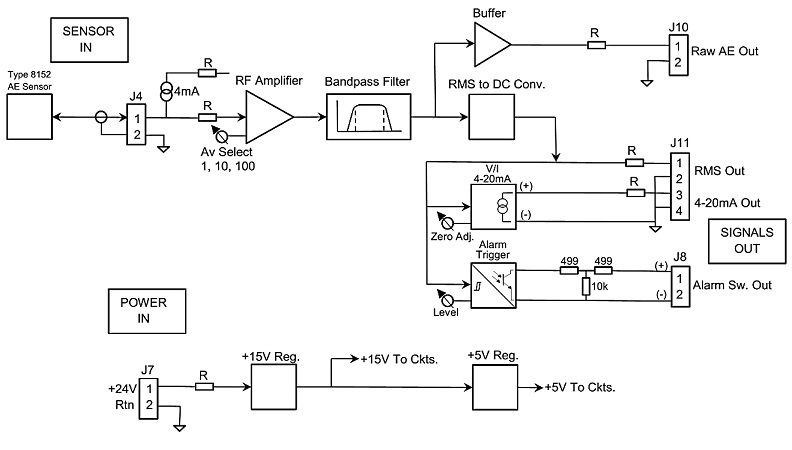
Table 1 shows the specification of the AES. Due to the extremely low current output, this device requires a conveyor to convert the signal from a current to a voltage, or simply to increase the power of the signal(13). The structure of the transmitter box is illustrated in Fig. 3.
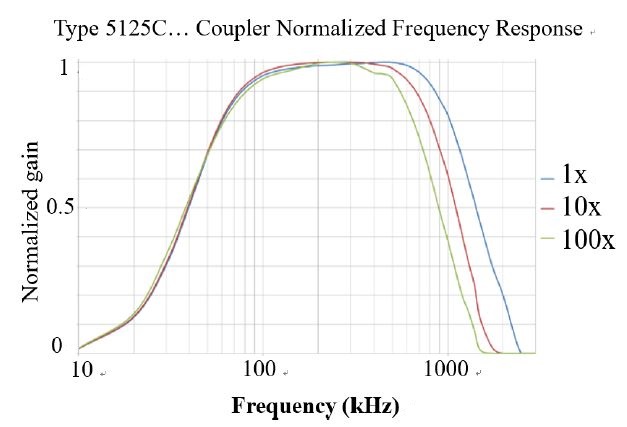
This device has 2 inputs and 4 output blocks. A direct current (DC) voltage of +24 V is required at the first input (J7) and the sensor signal connects to the remaining input (J4). The current input signal from the sensor is amplified and converted to a voltage by the RF Amplifier block with an adjustable gain. This gain can be adjusted by changing the position of two jumps (J5, J6) on the transmitter board. A bandpass filter block then regulates the output signal and only vibrations in a specific frequency range are allowed to be transmitted, as shown in Fig. 4. There are four types of output signals that include a raw AES output, the root mean square (RMS) output signal with a voltage, the RMS output with a current from 4 mA to 20 mA integrated zero adjustment element, and the alarm output with a contact type for the warning applications.
2.2 Medium Transmitter
The medium transmitter is one of the most important equipment employed to convert an analog signal from a sensor to a digital signal for transmission to a computer via a cable or peripheral component interconnection (PCI) slot. There are numerous approaches available for the collection and conversion of the signals generated from sensors including the use of NI equipment, a PCI card, an analog to digital converters (ADC), etc. The combination of this device and the sensors determines the range as well as the amplitude of the measured frequency.
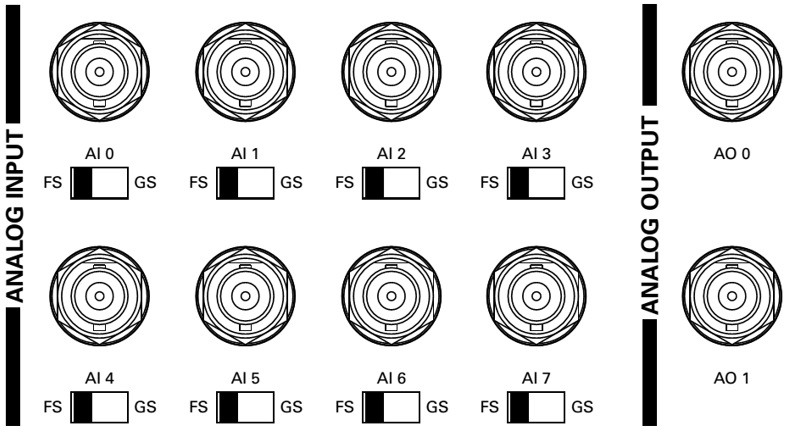
Fig. 5 shows the interface of the high-sampling rate NI USB 6366 BNC that was used in this application. The device specifications are summarized in the user manual(14) and the functionality includes analog input (AI), analog output (AO), digital input (DI), digital output (DO), general counters, frequency generator, etc. In the experiment, only the AI was used to connect with the Kistler AES to measure high-frequency vibrations. The computer receives high-frequency vibration signals from this device via a USB cable. The characteristics of the AI channel for this device are shown in Table 2.
According to this table, two outstanding issues appear during the experiment. Firstly, the programmer should change the input value depending on the actual value of the input signal because the default range is 1 V. The maximum working voltage is 11 V. If the input signal has a threshold that is higher than this value, the AI channels cannot measure this signal. The second issue is the overvoltage protection of all the AI channels that prevent damage to the equipment.
2.3 Monitoring and Analysis Software
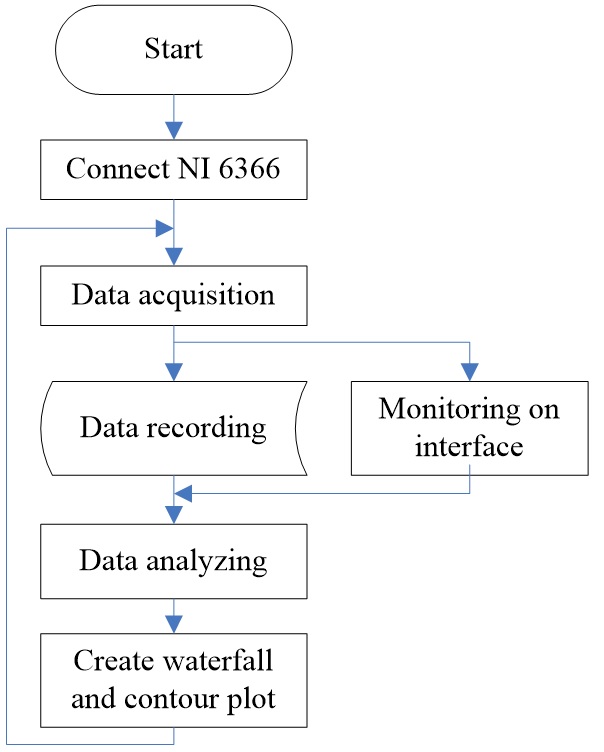
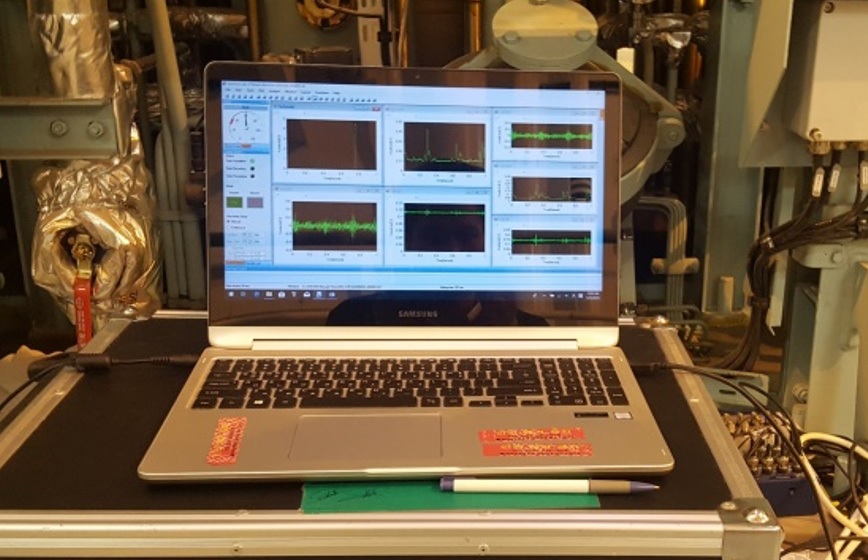
The engine vibration analysis and monitoring system (EVAMOS (Brand name of Dynamic Lab. of Mokpo Maritime University) AEC) S/W with AES using the C# programming language was designed to measure and monitor high-frequency vibrations of the engine. The main function of EVAMOS AEC S/W was to handshake with the NI USB 6366 BNC to receive, monitor, and record vibration signals. In addition, the S/W was flexible in choosing the sampling rate and the number of channels, changing the name of the channels, and analyzing the vibration signal. Based on the aforementioned requirements, the S/W consisted of three setup windows; namely, analyzer window, input channels window, and recording setup window. The real-time monitoring window is the main working interface and the analysis function was performed after the data recording process was completed. The flowchart of the program for measurement and analysis is illustrated in Fig. 6.
Firstly, the vibration data was measured and displayed on the monitoring interface, while also being recorded to analyze and estimate the state of the engine. Secondly, the data was analyzed using the Fast Fourier transform (FFT) method to determine the amplitude and frequency of each of the high-frequency vibrations. Finally, waterfall and contour plots were created based on the analyzed data.
3. Experimental Results
3.1 Implementation of the System
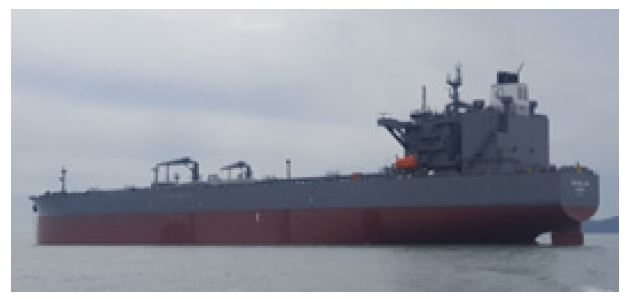
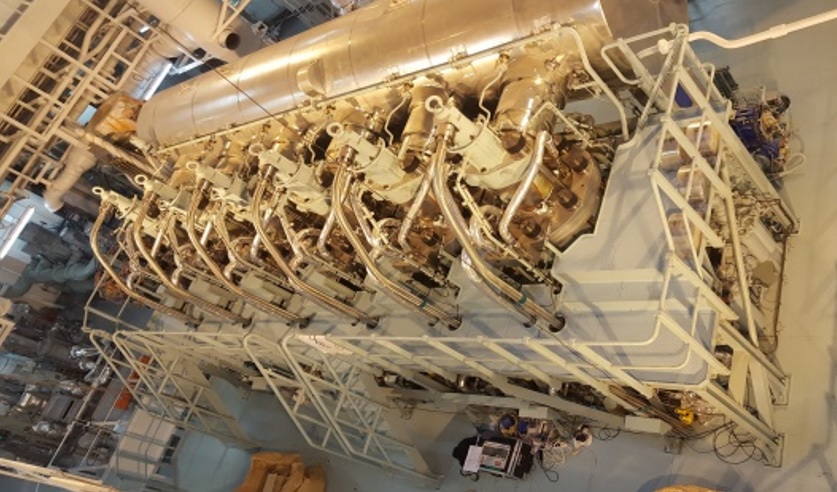
This investigation was conducted on cylinder no. 6 of the 158 k Deadweight Tonnage (DWT) oil tanker shown in Fig. 7. As displayed in Fig. 8, cylinder no. 6 is the nearest one to the turning wheel that is tested under the misfiring conditions during the sea trial process.
The vibration of the main engine was caused by the pressure of the combustion gases in addition to the reciprocating inertial force of the engine and the hydrodynamic force of the propeller. The specifications of the propulsion system of this vessel are summarized in Table 3.
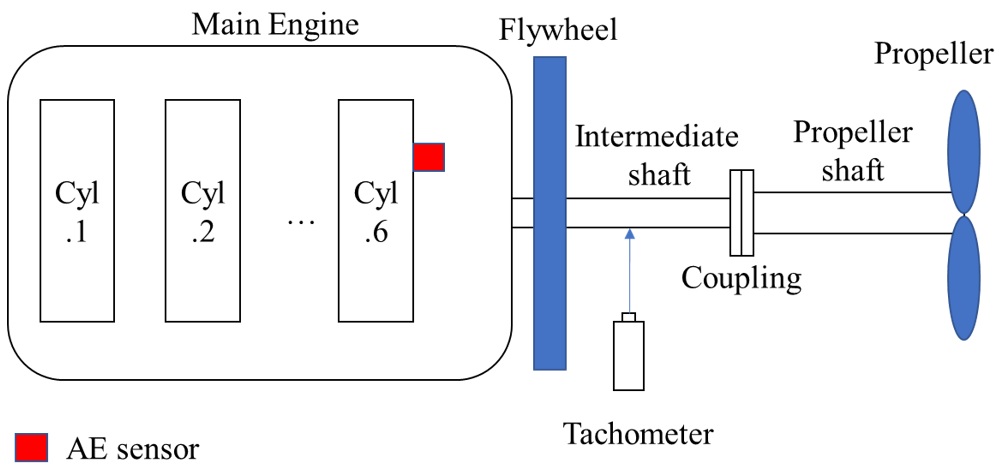
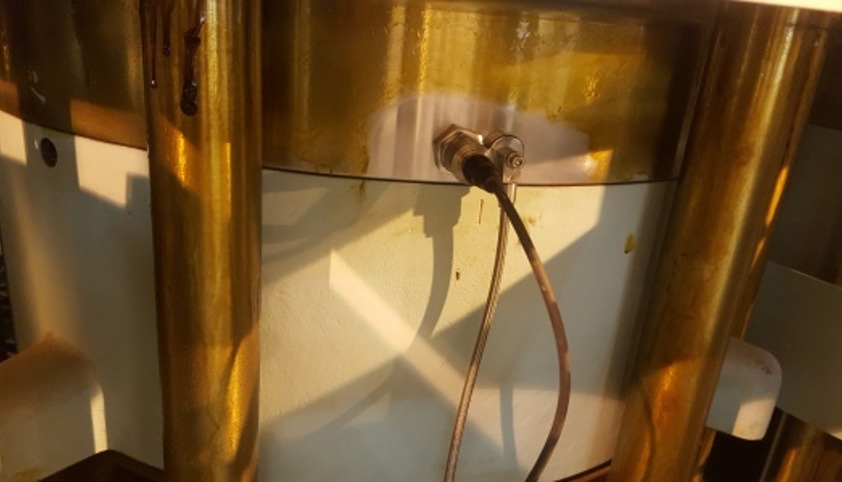
In this implementation, the Kistler AES was used to measure the high-frequency vibration in the horizontal direction of the cylinder, and a tachometer was utilized to measure the speed of the diesel engine. The arrangement of the sensors is shown in Fig. 9 and the real position is shown in Fig. 10.
3.2 Vibration Results
Measurements were performed using the same RPM under the normal firing and misfiring conditions of cylinder no. 6. The chosen sampling rate of the NI USB 6366 BNC was 2.00 MS/s, and the first channel was the default connection to the tachometer signal to determine the engine speed. Although the maximum continuous rating of the diesel engine was 73 r/min, the experiment could not be conducted at such a high revolution rate because the limit of engine speed under the misfiring conditions is only 60 r/min.
Comparing the data between the normal firing conditions and the misfiring conditions facilitate the determination of the different outstanding characteristics. Based on the measurements, it is also possible to determine the difference between the TB on and TB off conditions. A database can then be created to estimate the mechanical condition of the diesel engine.
Figures 12, 13 show the experiment results for the misfiring conditions. Figures 14, 15 show the results for the normal firing conditions for TB on, while Figs. 16, 17 show the results for the normal firing conditions for TB off.
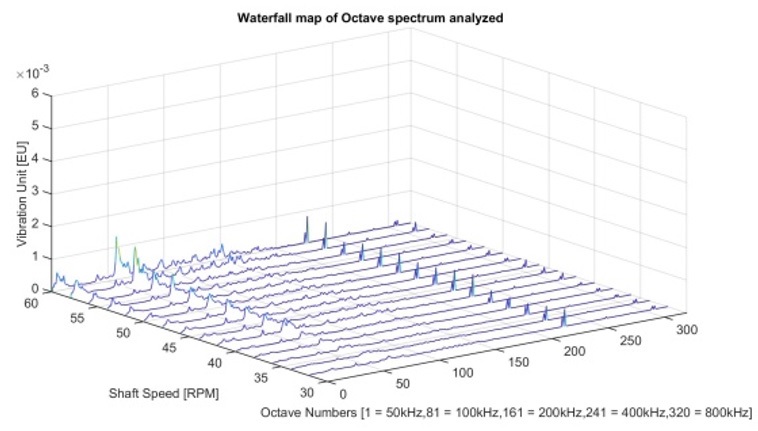
Result for vibration in the transverse direction (waterfall) for the body of cylinder no. 6 under misfiring conditions with TB on
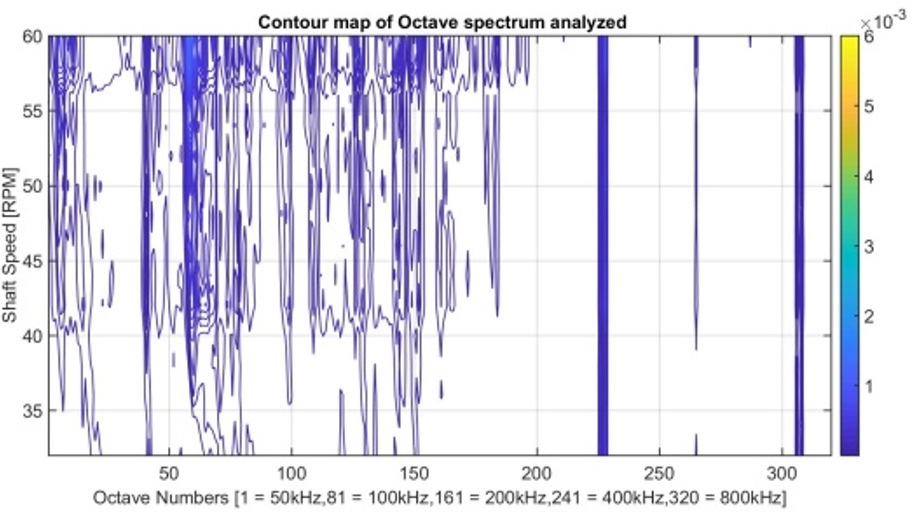
Result for vibration in the transverse direction (contour) for the body of cylinder no. 6 under misfiring conditions with TB on
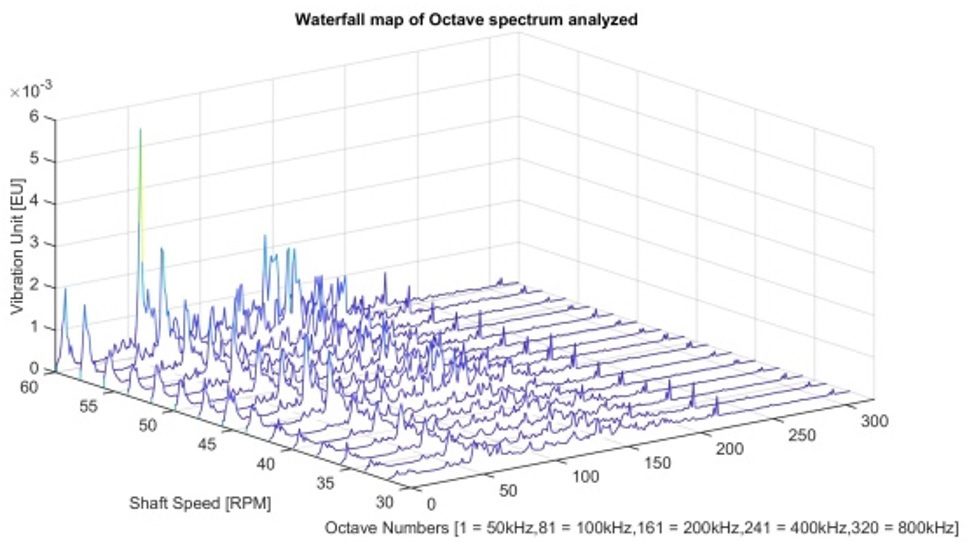
Result for vibration in the transverse direction (waterfall) for the body of cylinder no. 6 in the normal firing conditions with TB on
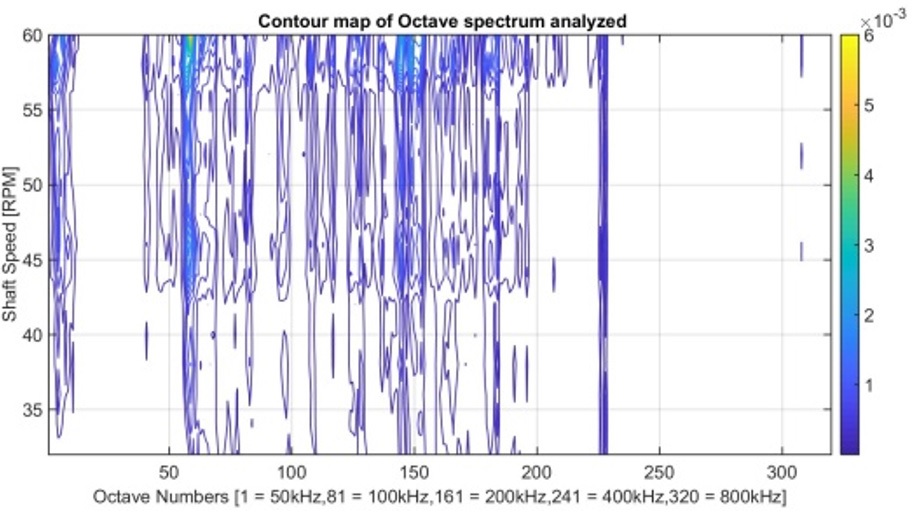
Result for vibration in the transverse direction (contour) for the body of cylinder no. 6 in the normal firing conditions with TB on
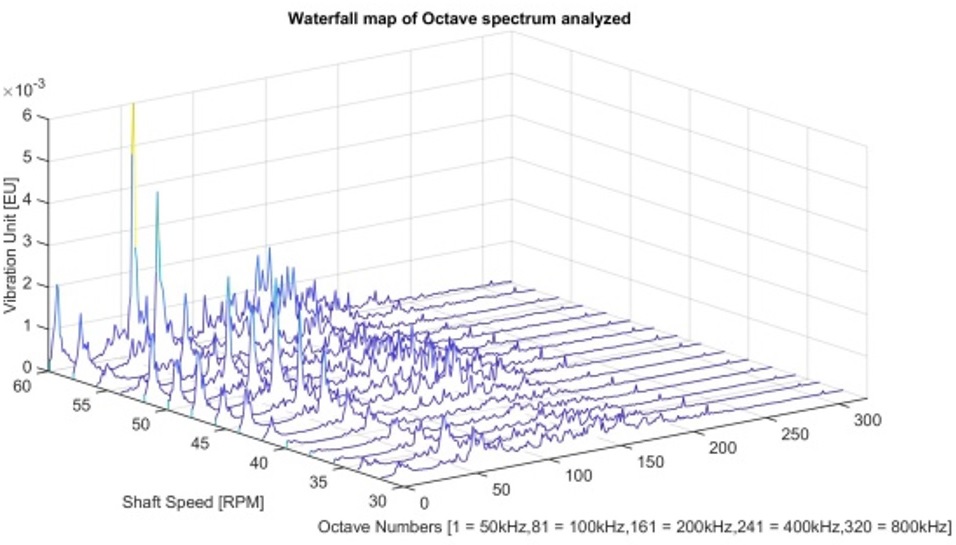
Result for vibration in the transverse direction (waterfall) for the body of cylinder no. 6 in the normal firing conditions with TB off
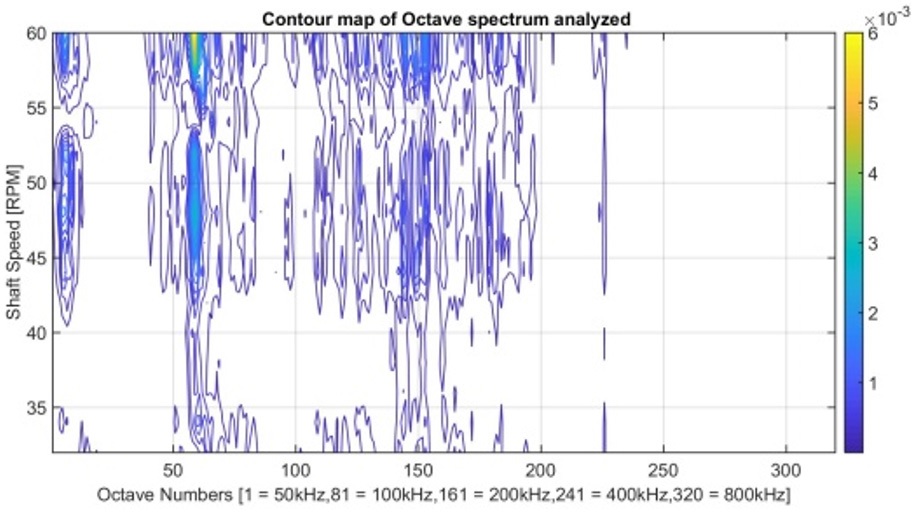
Result for vibration in the transverse direction (contour) for the body of cylinder no. 6 in the normal firing conditions with TB off
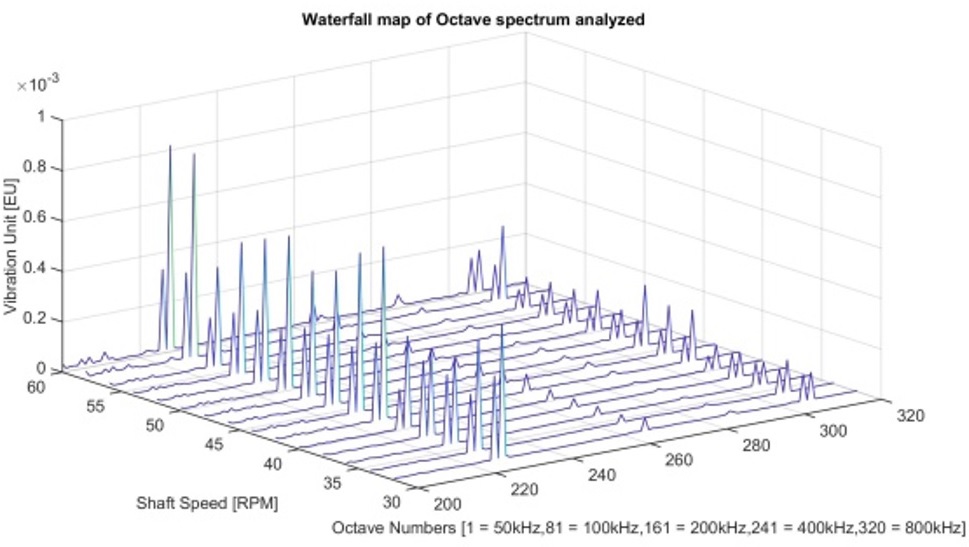
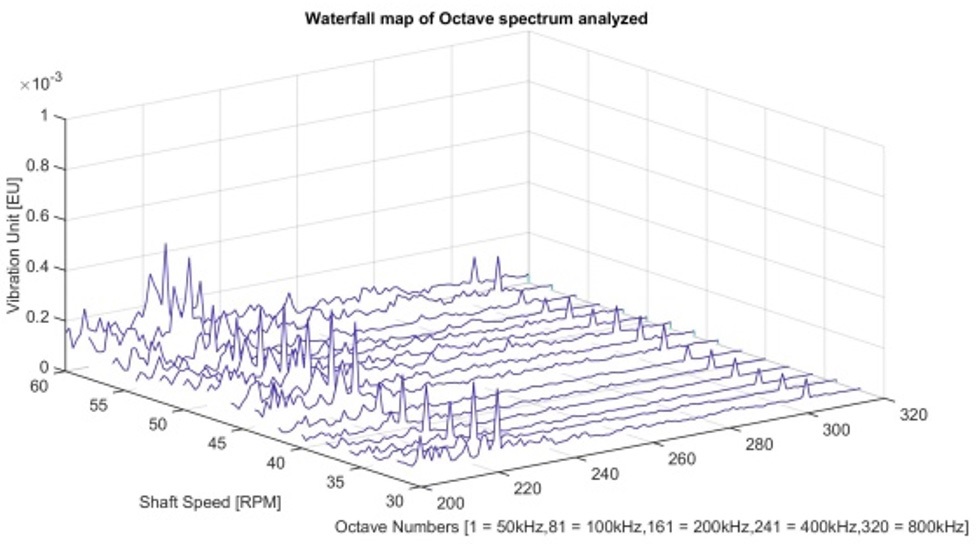
Result for vibration in the transverse direction (waterfall) for the body of cylinder no. 6 in the misfiring conditions with TB on
From the results shown in Figs. 12 ~ 15, it is evident that the vibrations that occur under the normal firing conditions have a larger amplitude that than the vibrations that occur under the misfiring conditions.
The vibration of the normal firing mode for TB on was similar to the case of TB off in the frequency range of 50 kHz to 300 kHz. However, they exhibited a small different for very high frequencies (approximately 350 kHz and 750 kHz). A different was not observed in the misfiring and normal firing conditions at these frequencies with TB on. The vibrations in the frequency range of 300 kHz and 350 kHz were smaller for the misfiring mode compared to the vibrations associated with the normal firing modes, as shown in Fig. 19.
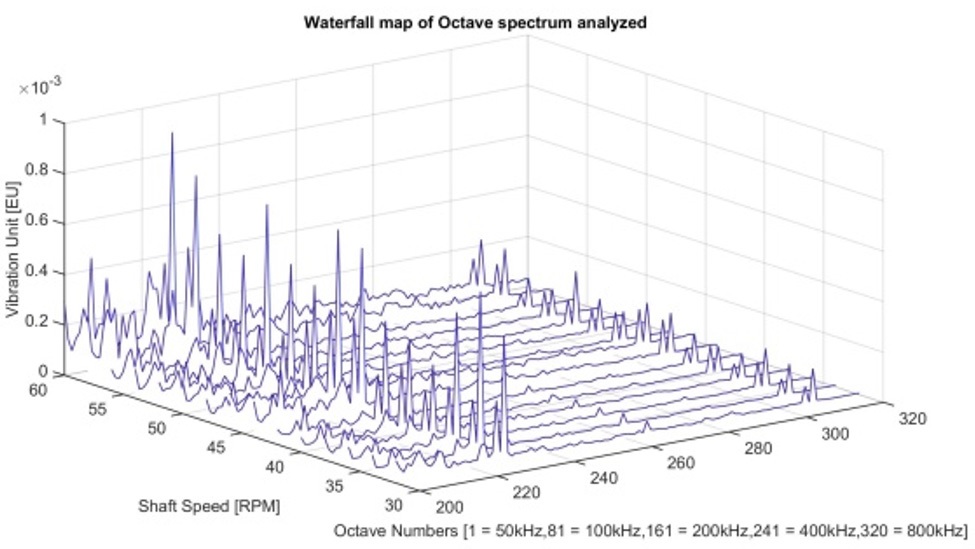
Result for vibration in the transverse direction (waterfall) for the body of cylinder no. 6 in the normal firing conditions with TB on
Based on Fig. 19, it is evident that the amplitude of the vibration at 350 kHz for TB on is higher than that for TB off. At approximately 750 kHz, there are two pulses for TB on but only one pulse for TB off, as shown in Fig. 20.
4. Conclusion
This study investigated the possibility of using an AE technique for high-frequency vibration measurement and other auxiliary equipment for application in a marine engine under the real-working conditions of a ship. The results revealed that the Kistler AES was consistent in terms of measuring vibrations in the high-frequency range from 50 kHz to 800 kHz. The equipment used functioned as expected under the real-working conditions of the investigated marine vessel. They were not affected by the ambient conditions of the ship. Although the temperature of the cylinder body was almost 110 °C, the AES still can still operate normally over a long period. The vibration measurements were conducted at 2 MS/s via 8 channels using EVAMOS AEC S/W. This implies that this system can be used to performed measurements on a marine diesel engine with a maximum of 7 cylinders (1 channel for the Tachometer signal and 7 channels for the 7 cylinders).
The vibration characteristics for 1/80 octave analysis differed for every operation mode and mechanical condition of the engine. According to the measured results, the difference between the vibration characteristics of the conditions was not similar for the complete range of investigated frequencies. In the case of the operation modes, only the range of frequencies lower than 350 kHz was useful for the detection of abnormalities, whereas higher frequencies were not useful. In contrast, for the mechanical modes, only frequencies at approximately 350 kHz and 750 kHz were useful, while the remaining data were not useful. Choosing a suitable range of frequencies in specific cases will further improve the speed of the processing stage. The output results obtained based on the Octave band frequency method have a smaller size compared to the raw data. These results proved that the AE technique is suitable for the investigation of high-frequency vibration characteristics and wave propagation in marine diesel engines for the real-working conditions of a ship.
A comparison of the vibrations associated with the instance value and stored data can assist in the detection of the firing state of a cylinder as well as the mechanical conditions (e.g. TB on-off) of the engine. These vibration characteristics can be used to build a database to facilitate the detection and diagnosis of abnormal operation in diesel engines by applying advanced methods such as machine learning.
Acknowledgments
This study was funded by the Ministry of Trade, Industry, and Energy of KOREA. In addition, it was performed under a government project entitled “Establishment of authorization test and certification center for medium/high-speed marine engines and related equipment”.
References
- Lin, T. R., 2011, Condition Monitoring and Diagnosis of Injector Faults in a Diesel Engine Using In-cylinder Pressure and Acoustic Emission Techniques, Proceeding of 14th Asia Pacific Vibration Conference, pp. 454~463.
-
Ahmad, T. A., 2019, Fault Detection of Injectors in Diesel Engines Using Vibration Time-frequency Analysis, Applied Acoustics, Vol. 143, pp. 48~58.
[https://doi.org/10.1016/j.apacoust.2018.09.002]

-
El-Ghamry, M., Steel, J. A., Reuben, R. L. and Fog, T. L., 2005, Indirect Measurement of Cylinder Pressure from Diesel Engines Using Acoustic Emission, Mechanical Systems and Signal Processing, Vol. 19, No. 4, pp. 751~765.
[https://doi.org/10.1016/j.ymssp.2004.09.004]

-
Elamin, F., Fan, Y., Gu, F. and Ball, A, 2010, Diesel Engine Valve Clearance Detection Using Acoustic Emission, Advances in Mechanical Engineering, Vol. 2010, No. 495741, p. 7.
[https://doi.org/10.1155/2010/495741]

-
Douglas, R. M., Steel, J. A. and Reuben, R. L., 2006, A Study of the Tribological Behavior of Piston Ring/cylinder Liner Interaction in Diesel Engines Using Acoustic Emission, Tribology International, Vol. 39, Vol. 12, pp. 1634~1642.
[https://doi.org/10.1016/j.triboint.2006.01.005]

-
Loutas, T. H., Sotiriades, G., Kalaitzoglou, I. and Kostopoulos, V., 2009, Condition Monitoring of a Single-stage Gearbox with Artificially Induced Gear Cracks Utilizing On-line Vibration and Acoustic Emission Measurements, Applied Acoustics, Vol. 70, pp. 1148~1159.
[https://doi.org/10.1016/j.apacoust.2009.04.007]

-
Elasha, F., Greaves, M., Mba, D. and Addali, A., 2015, Application of Acoustic Emission in Diagnostic of Bearing Faults within a Helicopter Gearbox, Proceedings of The Fourth International Conference on Through-life Engineering Services, pp. 30~36.
[https://doi.org/10.1016/j.procir.2015.08.042]

-
Tan, C. K., Irving, P. and Mba, D., 2007, A Comparative Experimental Study on the Diagnostic and Prognostic Capabilities of Acoustics Emission, Vibration and Spectrometric Oil Analysis for Spur Gears, Mechanical Systems and Signal Processing, Vol. 21, No. 1, pp. 208~233.
[https://doi.org/10.1016/j.ymssp.2005.09.015]

-
Sharma, R. B. and Parey, A., 2017, Condition Monitoring of Gearbox Using Experimental Investigation of Acoustic Emission Technique, Procedia Engineering, Vol. 173, pp. 1575~1579.
[https://doi.org/10.1016/j.proeng.2016.12.250]

-
Elforjani, M. and Mba, D., 2010, Accelerated Natural Fault Diagnosis in Low Speed Bearings with Acoustic Emission, Engineering Fracture Mechanics, Vol. 77, No. 1, pp. 112~127.
[https://doi.org/10.1016/j.engfracmech.2009.09.016]

-
Elasha, F., Greaves, M., Mba, D. and Fang, D., 2017, A Comparative Study of the Effectiveness of Vibration and Acoustic Emission in Diagnosing a Defective Bearing in a Planetry Gearbox, Applied Acoustics, Vol. 115, pp. 181~195.
[https://doi.org/10.1016/j.apacoust.2016.07.026]

- Kistler, Acoustic Emission Sensor – for High Temperature & Hazardous, Type 8152.
- Kistler, Acoustic Emission – Piezotron Coupler, Type 5125C.
- National Equipment, Device Specifications NI 6366, Series Data Acquisition 2 MS/s/ch, 8AI, 24 DIO, 2AO.

Dong Xuan Thin received his Master degree from Viet Nam Maritime University in 2014. He is Ph.D. candidate at Dynamics Lab. of Mokpo National Maritime University now.

Myeongho Song received his M. Eng. from Mokpo National Maritime University in 2008. He is now working Ship Repair Supporting Center. Also, he is Ph.D. candidate at Dynamics Lab. of Mokpo Maritime University.

Don Chool Lee received his Dr. Eng. from Mechanical Engineering department at Korea Maritime University in 1995. He worked at Hyundai Heavy Industries from 1983 to 1999. He is now a professor of Mokpo National Maritime University.
