인텐시티 맵의 패턴과 피드백 및 피드포워드 제어 성능간의 상관관계 분석
‡ Recommended by Editor Jae Young Kang
© The Korean Society for Noise and Vibration Engineering
Abstract
The intensity in structures provides varied information on structural dynamics. Thus, we utilized the intensity map to establish a novel approach to determine the active control source. We analyzed the control performance of active control systems applied on plates using the feedforward and feedback methods in terms of the structural intensity. The feedforward controller is designed in the frequency domain by minimizing the kinetic energy of the structure. The feedback control uses the direct velocity feedback method. The control gain of the feedback system was determined and used to obtain the best control performance, which is denoted by the total kinetic energy for the structure. Then, the variations in the intensity map patterns with the control strategies were analyzed to evaluate the correlations between the intensity flow and control performance. These correlations were investigated for all possible locations of the control forces over the entire structure. Consequently, it was confirmed that there is high correlation between the intensity flow and feedback control performance, and relatively higher correlation with respect to the feedforward control performance.
Keywords:
Active Vibration Control, Intensity Map Pattern, Feedback Control, Feedforward Control, Optimization키워드:
능동 진동 제어, 인텐시티 맵 패턴, 피드백 제어, 피드포워드 제어, 최적화1. 서 론
현대 사회에서는 다양한 곳에서 회전기계를 사용하고 있고, 그 결과 많은 기계 장치에서 진동이 발생하고 있다. 시설물에서 발생한 진동은 내구성에 나쁜 영향을 준다. 차량에서 발생한 진동은 탑승자의 편안함을 방해하고(1), 가전제품에서 발생하는 진동은 소음을 유발하고 삶의 질과 편안함을 하락시킨다(2). 이를 피하기 위해 많은 사람들이 진동을 저감하고자 연구를 진행했다(3).
다양한 선택지들 중 능동 제어는 시스템의 변화를 최소화하며 진동과 소음을 저감 할 수 있다. 기존 시스템의 효율을 유지할 수 있기 때문에 많은 분야들에 이를 적용하기 위한 연구가 이루어졌다. 그 중 능동 진동 제어 분야에서도 다양한 액츄에이터를 사용하고(4,5), 다양한 제어 알고리듬을 이용해 제어 성능을 높이는 연구들이 진행되었다(6,7).
능동 제어는 크게 피드백 제어와 피드포워드 제어로 나눌 수 있다. 피드백 제어는 시스템을 모를 때 사용하고, 피드포워드 제어는 시스템의 특성을 알 때 사용한다(8). 그 중 Lee, J. W. et al.(9)은 피드백 제어 시스템에서 가진력이 방출한 에너지가 제어력으로 수렴하는 소스-싱크 관계가 있다는 것을 인텐시티 맵을 이용해 확인했다. 인텐시티 맵은 구조물 내부의 진동 인텐시티 값을 계산하여 요소별로 나타낸 그림으로, 에너지의 발생과 전달하는 경로를 관측할 수 있다.
이 논문에서는 피드백 시스템에서 인텐시티의 이동이 유체의 흐름과 유사하다는 점에 착안해서, 인텐시티가 보다 더 흐르기 쉬운 위치와 그렇지 않은 위치에 제어력이 배치되었을 때 시스템의 제어 성능을 비교하고 분석했다. 이를 위해 외란이 형성하는 인텐시티 맵을 기준으로 흐르기 쉬운 위치를 분석해 제어력의 위치를 선정하였으며, 이 위치에서 전체 구조물의 피드백 제어 성능에 대해 분석했다. 또한 같은 위치에서 피드포워드 시스템의 제어 성능을 함께 분석하여 두 제어 시스템 사이의 제어 성능의 유사성을 탐색하였다.
2. 이론적 배경
2.1 능동 제어기 설계
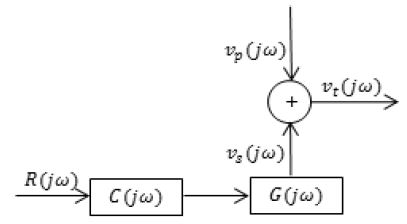
Fig. 1은 피드포워드 제어 시스템의 개략도를 나타내었다. 시스템의 응답 vt(jω)는 외란 vp(jω)와 제어력에 의한 속도 vs(jω)의 합으로 나타난다.
| (1) |
제어력에 의한 응답은 참조 신호 R(jω)가 제어기 C(jω)와 플랜트 G(jω)를 거쳐 발생한다.
| (2) |
시스템의 비용함수를 시스템 응답의 파워로 정의하면, 식 (3)과 같이 나타낼 수 있다.
| (3) |
이 때, 상첨자 H는 켤레 전치사이다.
시스템 비용함수는 제어기 C(jω)에 대해 이차 함수로 나타나고, 이를 최소로 만드는 최적의 제어기는 식 (4)와 같이 계산할 수 있다.
| (4) |
식 (1), 식 (3), 식 (4)를 정리하면, 최적의 피드포워드 제어기 Copt(jω)는 식 (5)와 같이 계산할 수 있다.
| (5) |
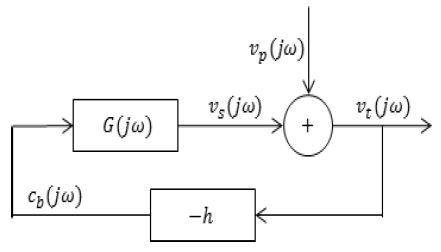
Fig. 2는 피드백 제어 시스템의 개략도를 나타내었다. 시스템의 응답은 식 (1)과 동일하게 외란과 제어력에 의해 발생한 속도의 합으로 나타난다. 하지만 피드백 루프를 통해 측정점의 속도가 제어 속도에 반영된다. 제어 속도 vs(jω)는 식 (6)과 같다.
| (6) |
여기서 h는 제어 게인이다.
식 (1)과 식 (6)을 이용해 정리하면, 피드백 제어 시스템에서 게인에 따른 시스템의 응답 vt(jω)은 식(7)과 같이 나타난다.
| (7) |
2.2 인텐시티 계산법
이 절에서는 정상 상태에서 진동 인텐시티를 계산하였다. 진동 인텐시티는 식 (8)과 같이 구조물에 작용하는 힘 F(jω)와 그 힘이 작용하는 방향의 속도 v(jω)의 곱으로 계산할 수 있다.
| (8) |
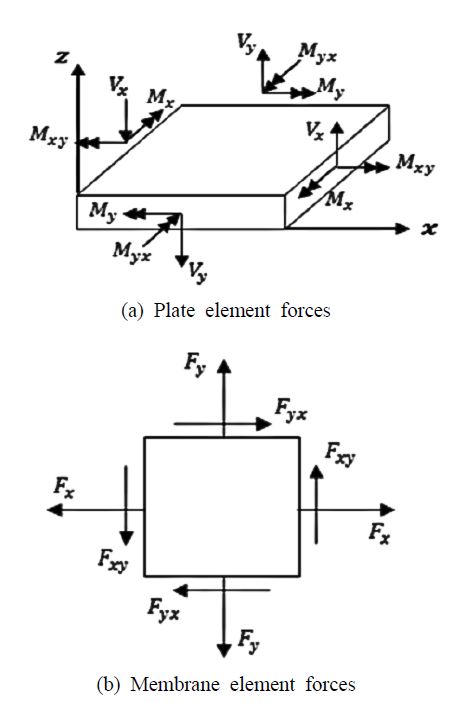
구조물 내부의 인텐시티를 계산하기 위해 유한요소법을 통해 구조물의 내력과 속도를 계산했다. Fig. 3은 평판 요소에 작용하는 내력에 대해 나타냈다. 평판요소의 내력은 out-of-plane에서 작용하는 plate element force와 in-plane에서 작용하는 membrane element force가 존재한다. 주파수별 인텐시티는 in-plane과 out-of-plane에서 각 방향의 내력과 속도 값의 곱으로 표현된다.
In-plane에서 발생하는 요소의 속도는 vx와 vy가 존재하며, out-of-plane에서 발생하는 속도는 , 그리고 vz가 존재한다. 각각의 속도와 내력을 같은 방향끼리 곱하면 평판 요소에 의한 인텐시티는 식 (9), 식 (10)과 같이 표현된다.
| (9) |
| (10) |
이때, Fx,Fy,Fxy 그리고 Fyx는 요소의 축력이고, Vx와 Vy는 전단력, Mx,My,Mxy 그리고 Myx는 요소에 작용하는 모멘트를 나타낸다. vx, vy, vz는 요소의 x, y, z방향 속도를, 는 x, y를 축으로 한 각속도를 나타낸다. Re는 복소수의 실수 부분을 나타낸다. 상첨자 *는 켤레 복소수를 의미한다.
3. 제어력 위치별 제어 성능 분석
피드백 제어 시스템에서 제어력의 위치 변화에 따른 제어 성능 변화를 인텐시티의 유체 관계에 대응하여 분석했다. 외란의 위치가 고정되어 있을 때, 제어력의 위치가 인텐시티의 이동이 보다 원활하게 이루어질 수 있는 위치에 존재한다면 더 높은 제어 성능을 보일 것으로 예상하고 몇 가지 경우에 대해 분석을 진행했다. 또한 이를 바탕으로 피드포워드 제어 시스템의 제어 성능도 인텐시티 맵과의 연관성이 있는지를 분석하였다.
해석 모델은 평판 모델을 사용했고 가로 0.6 m, 세로 0.5 m, 두께 10 mm에 7850 kg/m3의 밀도와 210 GPa의 영률, 0.3의 푸아송 비를 사용하였다. 그리고 네 모서리에 6자유도 구속을 사용하여 고정하였다. 외란의 위치는 (0.08 m, 0.4 m) 지점에 임의로 배치하였다. 해석 모델의 고유진동수는 1차 공진에서 74.5 Hz, 2차 공진에서 149 Hz로 나타났다.
이 구조물에 대한 최적의 피드포워드 제어기는 식 (5)를 바탕으로 계산했다. 피드백 제어기의 경우 식 (7)을 이용해 제어력이 배치되는 위치마다 게인에 따른 시스템의 제어 성능을 먼저 분석하고, 여러 게인 중에서 구조물의 총 운동에너지를 최소화 하는 게인을 사용했다.
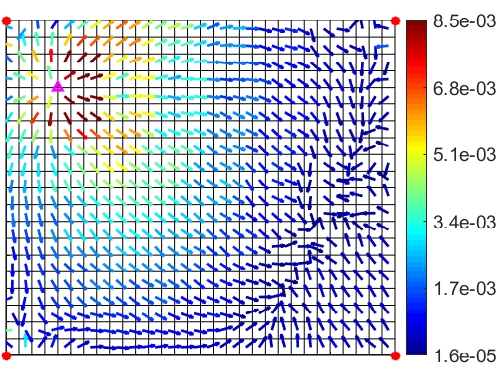
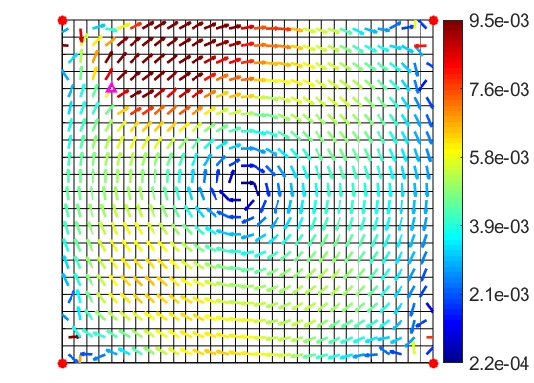
Fig. 4는 시스템의 1차 공진일 때 인텐시티 맵을 나타내었다. 이 때 외란 작용점에서 인텐시티는 방사형으로 퍼져나온다. 요소의 끝단에서 반사된 인텐시티에 의해 평판의 오른쪽 아래에서는 경계선을 형성하고, 외란 근처에서는 각도별로 방사되는 인텐시티의 크기가 달라진다. 외란에서 오른쪽 아래 방향으로 에너지가 가장 많이 방사되고, 그 다음이 오른쪽, 그리고 아래쪽 순으로 나타난다. 그리고 외란으로 멀어질수록 인텐시티의 크기가 작아진다. 이를 바탕으로 1차 공진에서는 외란과의 거리에 따른 제어 성능과, 외란과 이루는 각도에 따른 운동 에너지의 감소량을 dB로 나타내어 분석했다.
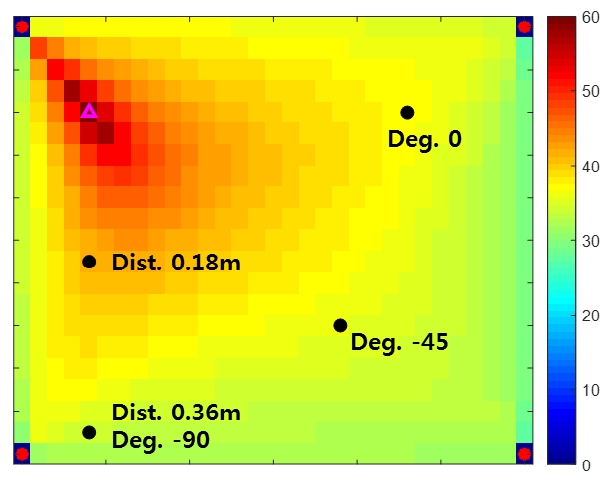
Fig. 5는 피드백 제어 시 전체 구조물의 제어 성능을 나타내었다. Fig. 5를 살펴보면 앞서 언급한대로 싱크가 소스에 가까워질수록 제어 성능이 높아지는 것을 확인 할 수 있다. 제어력의 위치가 외란에 가까워질수록 외란에서 방출된 인텐시티가 구조물로 퍼지지 않고 싱크로 수렴하여 에너지가 구조물로 전달되지 않고 구조물 전체의 에너지를 낮추는 데 기여하게 된다. 일반적으로 피드백 제어 시스템에 많이 선정되는 최대 변위 위치(구조물의 가운데)와 비교했을 때도 소스에 더 가까울수록 더 높은 제어 성능을 가진다. 또한 인텐시티가 가장 많이 방사되는 오른쪽 아랫방향(-45°)의 경우 다른 방향과 비교하면 더 높은 제어 성능을 가진다. 그리고 피드백 제어 시 구조물의 가장자리에서 낮은 제어 성능을 가진다. 이는 속도를 피드백 하는 제어 시스템 특성상 속도가 작은 지점에서 피드백 제어를 적용하면 높은 게인을 필요로 하고, 이는 전체 주파수 관점에서 시스템의 제어 성능에 악영향을 미치기 때문이다.
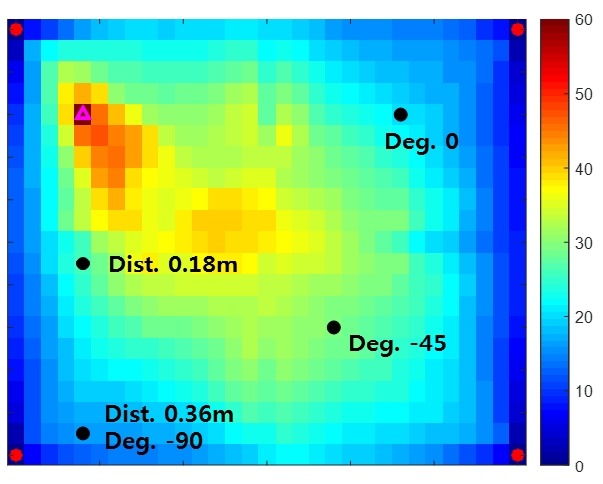
Control performance of the plate of feedback control system in 1st resonance (74.5 Hz). The control performance is denoted by the reduction of kinetic energy in dB
Fig. 6의 경우 피드포워드 제어 시스템의 전체 구조물 제어 성능을 나타내었다. 이 경우 피드백과 다른 두 가지 특징을 확인할 수 있는데, 첫째로 인텐시티가 강한 방향으로 높은 제어 성능이 나타나던 피드백 시스템과는 다르게 에너지 소스에 대칭적으로 제어 성능이 분포하는 것을 확인할 수 있다.
Control performance of the plate of the feedforward control system at the 1st resonance (74.5 Hz). The control performance is denoted by the reduction of kinetic energy in dB
또한 피드백 제어 시에는 구조물의 응답이 작은 곳에서 낮은 제어 성능을 나타내는데, 피드포워드 제어 시스템의 경우 고정단을 제외한 임의의 위치에 제어력이 배치되어도 약 30 dB 이상의 제어 성능을 가지는 것을 확인할 수 있다.
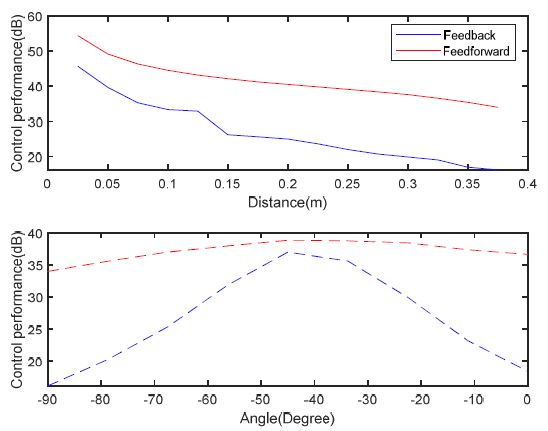
Fig. 7은 1차 공진에서 제어력의 거리 및 각도 별 피드백 및 피드포워드 제어 성능을 나타내었다. 두 제어 시스템 모두 앞서 분석한 대로 소스-싱크 간의 거리가 멀어질수록 제어 성능이 낮아지는 것을 확인할 수 있다. 각도 별 제어 성능에서도 앞서 분석한 것과 같은 결과를 얻을 수 있는데, 제어력이 외란의 아래쪽인 -90°에 위치하는 경우 가장 낮은 인텐시티 방사율을 보이고 가장 낮은 제어 성능을 가진다. 제어력이 외란의 대각선 아래 방향에 가까워질수록 높은 인텐시티 방사율에 의해 제어 성능이 높아지다가, 제어력이 외란의 오른쪽인 0° 방향에 가깝게 배치될수록 다시 제어 성능이 낮아진다. 제어력이 –90°에 배치된 경우와 0°에 배치된 경우를 비교하면 앞서 Fig. 4에서 분석했던 대로 오른쪽으로 방사되는 인텐시티가 더 많으므로, 같은 거리임에도 오른쪽에 배치되었을 때 더 높은 제어 성능을 가진다. 또한 피드포워드 제어 시스템은 피드백 시스템과 비교했을 때 항상 더 높은 제어 성능을 발휘한다. 1차 모드에서는 피드포워드의 제어 성능이 전체적으로 높기 때문에 차이가 크지 않지만, 각도와 거리에도 영향을 받는 것을 확인할 수 있다.
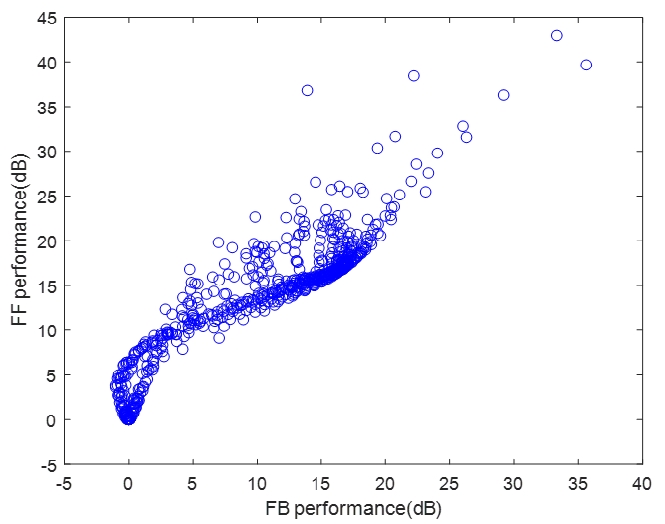
Fig. 8은 피드백 제어 성능과 피드포워드 제어 성능간의 상관관계를 그래프로 나타내었다. 두 제어 성능 간에는 R=0.75의 상관계수를 가지는 것을 확인하였다. 상관계수를 낮추는 원인으로는 외란 작용점 주변과 인텐시티가 약하지만 피드포워드 제어 성능이 높은 구조물의 왼쪽 윗부분에서 두 제어 성능이 많이 차이 나기 때문인 것을 확인할 수 있었다.
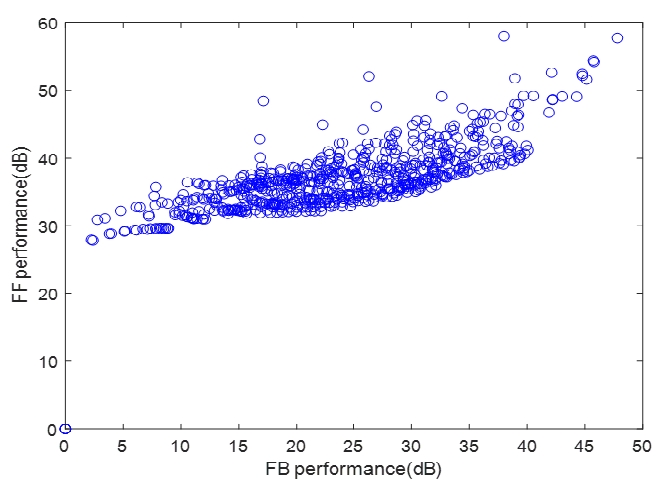
Correlation between feedback control and feedforward control performance at the 1st resonance (74.5 Hz)
Fig. 9은 2차 공진의 인텐시티 맵을 나타내었다. 2차 공진의 경우, 원형으로 회전하는 형태의 인텐시티 맵을 가진다. 외란에서 인텐시티가 시계방향으로 방사되며, 평판의 가운데를 제외한 구조물의 전체에 고른 크기의 인텐시티가 분포되어 있다. 2차 공진의 경우 인텐시티가 회전함에 따라 방향성이 있으므로, 1차 공진과 다르게 외란과의 거리를 정의할 때 물리적 거리뿐만 아니라 가운데를 기준으로 외란과 이루는 각도 또한 중요한 요인이 된다.
Fig. 10은 2차 공진에서 피드백 제어 시 제어력이 배치되는 위치별 제어 성능을 나타내었다. Fig. 10을 살펴보면 앞서의 분석을 반영한 싱크 위치별 제어 성능을 확인할 수 있다. 1차 공진때와 마찬가지로, 싱크의 위치가 소스의 위치에서 멀어질수록 제어 성능이 낮아지는 것을 확인하였다. 또한 외란과 이루는 각도 또한 중요하기 때문에, 연두색 마커로 표시된 것처럼 인텐시티의 역방향에 배치되는 경우 소스와의 물리적인 거리는 가깝지만 각도가 360°에 가까워지게 되어 제어 성능이 극도로 나빠져 제어 후 운동에너지의 감소 폭이 크게 줄어든다. 또한 인텐시티의 크기가 거의 없는 가운데 지점의 경우 외란에서 제어력으로 에너지가 전달되지 못하여 피드백 제어에 의한 제어 성능이 없다. 그리고 시스템의 노달 포인트 및 속도가 작은 지점에서 제어 성능이 거의 나타나지 않는 것을 확인할 수 있다.
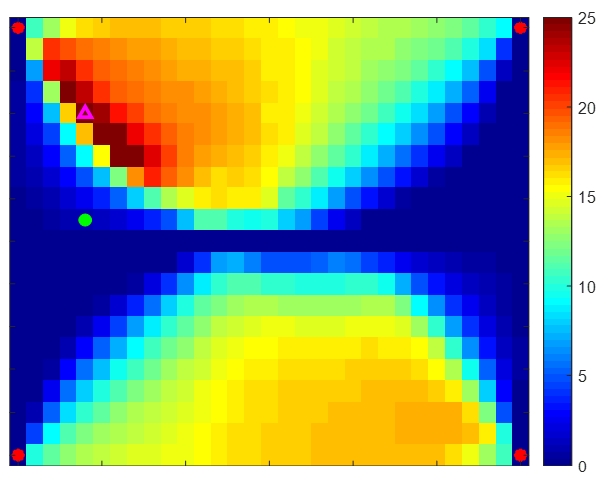
Control performance of the plate of the feedback control system at the 2nd resonance (149 Hz). The control performance is denoted by the reduction of kinetic energy in dB
종합해보면 1차 공진과 동일하게 소스와의 거리가 가깝고, 인텐시티가 흐르기 쉬운 곳에 싱크가 위치할수록 더 높은 피드백 제어성능을 나타내는 것을 확인할 수 있다.
Fig. 11에 나타난 2차 공진에서 시스템의 피드포워드 제어 성능 분포는 피드백 시스템에 대해 분석했을 때와 유사하게 나타났다. 하지만 피드백 시스템에 비해 노달 포인트 및 속도가 작은 지점에서의 제어 성능이 조금 더 높게 나타나고, 파워가 흐르는 방향의 역방향에 존재할 때 제어 성능의 하락도 피드백 시스템에 비해 작게 나타나는 것을 확인할 수 있다.
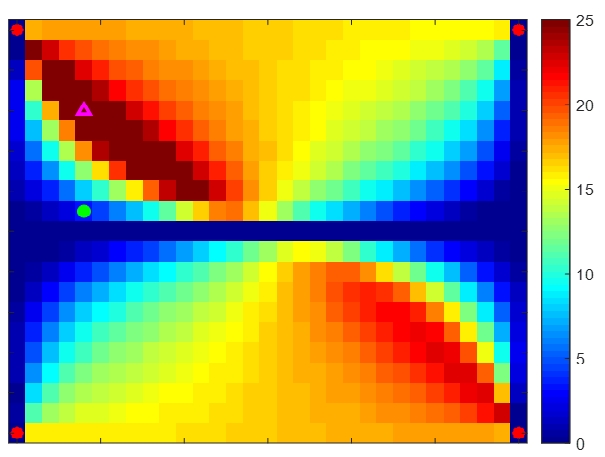
Control performance of the plate of the feedforward control system at the 2nd resonance (149 Hz). The control performance is denoted by the reduction of kinetic energy in dB
Fig. 12는 2차 공진에서 피드백 제어 성능과 피드포워드 제어 성능간의 상관관계를 그래프로 나타내었다. 두 제어 성능 간에는 R=0.91의 상관계수를 가지는 것을 확인하였다. 1차 공진과는 다르게 두 제어 전략 모두 유사한 성능 분포를 가지고 있어 상관관계가 높게 나타났다. 상관계수를 낮추는 원인으로는 시스템의 노달 포인트 등 속도가 낮은 지점에서 피드포워드와 피드백 제어 성능이 많이 차이 나는 지점들이 존재하기 때문이다.
4. 결 론
이 연구를 통해 인텐시티 맵을 바탕으로 피드백 및 피드포워드 제어 시스템의 제어 성능에 대해 분석했다. 피드백 제어의 경우 외란과 제어력의 소스-싱크 관계가 유체와 비슷하다는 가정 하에 분석을 진행하였고, 다음 결론을 얻을 수 있었다.
(1) 피드백 제어 시스템의 제어 성능 분포는 외란에서 방출된 인텐시티의 패턴과 밀접한 연관이 있으며, 인텐시티 방사율이 높은 방향 및 지점에서 더 높은 제어 성능을 가지는 것을 확인했다.
(2) 피드포워드 제어 시스템의 경우 1차 공진에서는 비교적 약한 유사성을 보인다. 하지만 2차 공진에서는 인텐시티 맵과 높은 연관성이 있는 제어 성능 분포를 가지는 것을 확인했다.
(3) 피드백과 피드포워드 제어 성능 분포 간에는 일정한 상관관계를 가지는 것을 확인할 수 있다. 두 제어 방법은 유사한 제어 성능 분포를 가지지만, 시스템의 노달 포인트나 외란 근처 등의 지점에서는 제어 성능이 정비례 하지 않는 것을 확인했다.
이러한 분석을 통해 제어 시스템의 성능을 인텐시티 맵을 통해서 예측하고 최적의 위치에 액추에이터를 배치할 수 있음을 확인했다. 이 연구는 단일 외란에 대해 연구를 진행하였는데, 다양한 형태의 외란에 대해 인텐시티 맵을 계산할 수 있는 연구를 진행할 예정이다.
References
-
Park, D. K., Jeong, W. B., Song, J. T., Park, J. H., Park, J. P. and Ahn, S. J., 2018, Evaluation on Health Effect of Military Vehicle Driver Exposed to Vibration on Cross-country Road on Compliance with ISO 2631-1, Transactions of the Korean Society for Noise and Vibration Engineering, Vol. 28, No. 1, pp. 23~30.
[https://doi.org/10.5050/KSNVE.2018.28.1.023]

-
Kong, K. S., Jeong, W. B., Kim, T. H., Shin, D. S. and Ahn, S. J., 2016, Psychoacoustical Study for Sound Quality Index of Steady State Noise of Refrigerators, Transactions of the Korean Society for Noise and Vibration Engineering, Vol. 26, No. 5, pp. 536~545.
[https://doi.org/10.5050/KSNVE.2016.26.5.536]

-
Wrona, S. and Pawelczyk, M., 2014, Active Reduction of Device Multi-tonal Noise by Controlling Vibration of Multiple Walls of the Device Casing, 19th International Conference on Methods and Models in Automation and Robotics (MMAR), pp. 687~692.
[https://doi.org/10.1109/MMAR.2014.6957437]

- Xu, Y., Li, Z. and Guo, K., 2018, Active Vibration Robust Control for FGM Beams with Piezoelectric Layers, Structural Engineering and Mechanics, Vol. 67, No. 1, pp. 33~43.
-
Wang, W. and Thomas, P. J., 2017, Low-frequency Active Noise Control of an Underwater Large-scale Structure with Distributed Giant Magnetostrictive Actuators, Sensors and Actuators A: Physical, Vol. 263, pp. 113~121.
[https://doi.org/10.1016/j.sna.2017.05.044]

-
Thai, N., Wu, X., Na, J., Guo, Y., Trung Tin, N. T. and Le, P. X., 2017, Adaptive Variable Step-size Neural Controller for Nonlinear Feedback Active Noise Control Systems, Applied Acoustics, Vol. 116, pp. 337~347.
[https://doi.org/10.1016/j.apacoust.2016.09.022]

-
Wu, L., Qiu, X., Burnett, I. S. and Guo, Y., 2018, Decoupling Feedforward and Feedback Structures in Hybrid Active Noise Control Systems for Uncorrelated Narrowband Disturbances, Journal of Sound and Vibration, Vol. 350, pp. 1~10.
[https://doi.org/10.1016/j.jsv.2015.04.018]

-
Fuller, C. R., Nelson, P. A., and Elliott, S. J., 1996, Active Control of Vibration, Academic Press.
[https://doi.org/10.1016/B978-012269440-0/50007-8]

- Lee, J. W., Jeong, W. B. and Hong, C., 2016, Analysis for Active Vibration Control Performance of Plate Using a Vibration Intensity, Proceedings of the KSNVE Annual Autumn Conference, pp. 154.

Jeong-Mo Ku received B.S. degrees from Pusan National University in 2015 and M.S. degrees from Pusan National University in 2017. He is currently majoring in noise and vibration in Pusan National University. He especially is interested in active noise control.

Junwoo Lee received B.S. degrees from Pusan National University in 2015 and M.S. degrees from Pusan National University in 2017. He is currently majoring in noise and vibration and health care in Pusan National University. He especially is interested in signal processing of the medical system.
Weuibong Jeong received B.S. and M.S. degrees from Seoul National University in 1978 and from KAIST in 1980, respectively. He then received his Ph.D. degree from Tokyo Institute of Technology in 1990. Dr. Jeong is currently a professor at the department of mechanical engineering at Pusan National University in Busan, Korea. His research interests are in the area of the measurement and signal processing, finite/boundary element analysis of noise and vibration, fluid-structure interactions and acoustic-structure interactions.

Chinsuk Hong received B.S. in mechanical engineering and an M.S. in dynamic and vibration from Youngnam University, Korea, in 1988 and 1991, respectively. He worked for the Naval System Development Center in Agency Defense Development (ADD), Korea, for 12 years from 1991. He then joined the Institute of Sound and Vibration Research (ISVR), University of Southampton, UK, in 2003, to pursue his Ph.D. He received the Ph.D. in sound and vibration, in 2005, He was then with ISVR as a research fellow until 2006, and was a research professor for 3 years at Pusan National University. He is currently a professor at School of Mechanical Engineering, Ulsan College since 2009. His research interests include active noise and vibration control, flow-induced noise and underwater shock response analysis.
