닐센 아치교 케이블 장력에 대한 관리기준치 설정에 관한 모니터링 연구
© The Korean Society for Noise and Vibration Engineering
Abstract
This study monitors the Nielsen Arch Bridge using U-Network, both during and after construction. The U-Network monitoring system consists of a sensor part that detects structural behavior, a data logger part that stores and measures signals from the sensor, a communication part that connects each data logger, and a main server for data collection and processing. The installation of the monitoring sensor was performed in compliance with principles that aim to minimize damage towards the target structure and secure long-term durability, as well as maximize the sensor’s maintenance efficiency. Furthermore, the sensor was field-tested after installation to ensure that it is properly installed without any errors. The stability and reliability of the bridge was assessed by a structural analysis using monitoring and finite element analysis.
To adapt and develop the U-Network system as a tool to monitor bridge, the Unique Feature Identifier technology, Geographical Information System 3D technology, and collaboration with local government and organizations shall be needed. A linkage plan to incoporate the technology into management systems of existing facilities is required to be prepared and followed by continuous research investments.
Keywords:
Cable Bridge, Management Limit Measure, Cable Tension, Measuring System, Nielsen Arch Bridge키워드:
케이블교량, 관리한계치 산정방법, 케이블 장력, 계측 시스템, 닐센 아치교1. 서 론
현재까지 모니터링 시스템을 통한 구조물의 이상거동 판정은 구조해석을 통해 미리 설정한 관리한계치와 구조물로부터 얻은 계측 값을 비교함으로써 행해지고 있다. 따라서 계측 값이 관리한계치를 상회한다면 이는 구조물이 이상거동을 하고 있다는 것으로 해석하고 교량통행의 통제 또는 보수 등을 실시하도록 하고 있다.
국내에서 수행된 관리한계치에 대한 연구로는 전문가 설문조사를 통한 흙막이 구조물 공사에 있어서 관리한계치에 대한 신뢰도 분석이 수행(1)된 바 있으며 장대교량에 대해서는 신뢰성에 기초한 사장교 케이블의 장력관리를 위한 관리한계치 설정에 관한 연구가 수행(2)된 바 있다. 그러나 닐센 아치교 같은 특수교량에 대한 케이블 관리한계치 설정방안에 대한 연구는 거의 없는 실정이다.
일반적으로 닐센 아치교에 사용되는 행어는 사장교에 사용되는 stay cable과 같다. Stay cable의 구성은 사장재(고인장력 저항), 튜브, 정착장치, 채움재(부식방지) 등으로 이루어진다. Stay cable은 행어 배치에 따라 케이블의 장력 변동이 상이하므로 상황에 따른 케이블 장력관리의 필요성이 매우 높다.
2. 케이블 장력 추정에 대한 이론
장력추정 방법은 현재 실무에서 일반적으로 간접법을 주로 채택하고 있으며 이 논문 역시 간접법을 통한 장력추정에 대한 이론과 방법을 검토하였다.
장력추정 간접법은 크게 케이블 변형률을 이용하는 방법과 케이블의 진동을 이용하는 방법이 있다. 이중 케이블 진동 시 케이블 가속도를 통해 고유진동수의 변화를 매개로하는 케이블 진동모드에 따라 측정된 고유진동수를 적용하여 케이블 장력을 추정한다(3).
해당 방법에서는 가속도센서를 이용하여 데이터를 수집하며 안정된 데이터를 확보하기 위해 일반적으로 20분간의 데이터를 확보한다. 그 후 불필요한 주파수 필터링과 같은 처리작업을 수행한다. 그리고 파워스펙트럼을 통한 해당 케이블 고유진동수를 확보하고 푸리에 변환을 이용하여 장력을 추정하였으며, 케이블 장력은 현 이론식을 이용한 현에 작용하는 장력 방정식의 해를 구할 수 있다. 이 경우 케이블 휨 강성을 고려한 경우와 무시한 경우로 나누어진다.
식 (1)은(4) 케이블 휨 강성을 무시한 경우의 방정식이다.
| (1) |
y : 진폭
w : 단위길이당 케이블 무게
g : 중력가속도
x : 길이방향의 좌표
t : 시간
식 (1)을 양단고정 경계조건으로 해석하면 식 (2)와(5) 같은 장력을 구하는 식을 도출할 수 있으며, 이는 단순한 현의 진동으로부터 구할 수 있다.
| (2) |
fn : n차 고유진동수
ℓ : 케이블의 길이
3. 닐센 아치교의 케이블 장력 모니터링
3.1 대상 시설물의 현황
Table 1은 모니터링을 위한 대상시설물은 철근콘크리트 교량의 교각이며 하중기반설계법을 통해 내진설계가 이루어졌다. 역량스펙트럼을 이용하여 대상교각의 내진성능을 평가하고, 변위기반 해석과 하중기반 해석을 비교분석하여 실제로 내진성능을 확보하고 있는지 검토할 수 있다.
3.2 계측 시스템의 구성
구조물을 이루고 있는 부재의 분석을 통하여 장기적이고 효율적인 유지관리를 위해서 계측데이터 확보를 위한 계측센서의 부착은 구조물의 거동을 확인할 수 있는 대표단면에 설치된다. Table 2는 구조물의 거동분석을 통해 교량 구조물의 유지관리를 위한 계측항목 및 센서 설치 위치를 나타낸다.
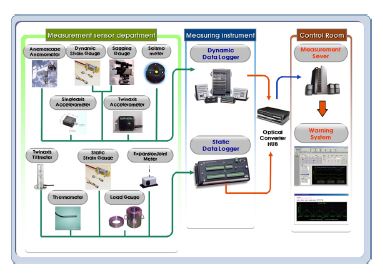
Table 3에서 온도계, 변형률계, 경사계 등은 정적데이터로거에 연결되며, 케이블 가속도계, 지진계, 처짐계, 풍향풍속계 등은 동적데이터로거에 연결된다(Fig. 1 참조).
계측된 데이터 전송은 기존의 사용되어온 다양한 통신 시스템을 통해 이루어진다. 이는 해당 구조물과 주변의 여건에 따라 적합한 시스템을 적용하면 된다.
대상 교량의 계측은 실시간으로 이루어지는 계측시스템을 갖추고 있어 실시간으로 안정적으로 데이터 전송이 이루어야 한다. 교각(P2)에 설치된 데이터로거의 방대한 양의 데이터가 계측관리를 담당하는 컴퓨터로 전송된 후 실시간으로 대상 교량을 모니터링해야 한다. 이를 위해 Table 4와 같이 optical network를 구축하여 이용한다.
4. 닐센 아치교의 케이블 장력 모니터링
4.1 관리한계치 설정 목적
교량의 거동은 교량형식, 하중 특성 등 다양한 조건에 의해 지배된다. 따라서 이러한 교량의 특성, 외부조건, 자료의 변화속도 및 안정성 여부를 충분히 검토하여 적절한 관리기준치와 모니터링 빈도를 Table 5와 같이 설정하였다. 즉, 자료의 변화속도가 빠른 모니터링 항목은 측정 빈도를 높이고, 장기간에 걸쳐 변화량이 미세한 모니터링 항목은 빈도를 낮추는 것이 합리적이며, 안전성과 관련이 깊은 모니터링 항목은 측정 빈도를 높인다.
① 케이블 장력의 확률분포 모형 설정 : 케이블 장력에 따른 이론적 확률분포 모형을 확정하고 확률적 변량을 갖는 케이블 장력을 취급한다.
② 케이블 장력의 관리한계치 설정 : 신뢰성 이론을 바탕으로 효율적 관리가 가능한 관리한계치 수준 설정하며 교량 구조물의 안전성은 신뢰성 이론을 적용하기 위한 한계상태방정식의 구성요소와 관계된다.
4.2 케이블의 장력 Data 측정
다음의 장력 측정값은 19.12.12. ~ 20.01.12.사이에 가속도계를 이용하여 계측하였다. Table 6은 진동법을 기반으로 하는 Daqview(장력계산프로그램)을 통해 산출되었다.
여기서 기준 주파수 = 1.070 Hz, 케이블 단위 중량 = 0.24 kN/m를 사용하였다.
4.3 Cable의 영향선 해석
케이블의 영향선 해석의 목적은 케이블의 비선형적 거동을 파악하는데 있다. 이 과정에서 케이블의 자중으로 인해 발생되는 Sag에 의한 케이블 탄성계수(Ec)의 변화를 고려해야한다. Ernst방법에 의하면 케이블의 등가탄성계수는 식 (3)과 같다.
| (3) |
w : Acγ(케이블 단위길이당 중량)(N/mm)
L : 케이블의 길이(mm)
Ee : 재료의 탄성계수(Mpa)
Eq : 케이블의 등가탄성계수(Mpa)
To : 초기케이블의 장력(N)
Tf : 하중증가 따른 최종 케이블 장력(N)
케이블의 등가탄상계수 산정은 대상 구조물인 닐센 아치교 케이블 중 최장 길이를 갖는 케이블의 장력 값을 적용한다.
교량 가설 시 닐센아치교의 사하중에 의한 값을 고려하여 초기 케이블 장력을 산정하며, 교량 가설 완료 후 가능한 하중조합을 고려한 최대 장력 값을 적용하여 최종 케이블 장력을 산정한다.
식 (3)에 의해서 Eq값을 Ec값과 비교하면 99.21%정도로 나타난다(식 (4)).
| (4) |
이는 탄성계수 변화는 매우 미소하여 무시할 수 있으며 케이블의 영향선 해석 시 케이블의 비선형성은 고려하지 않고 탄성거동만을 고려할 수 있음을 보여준다.
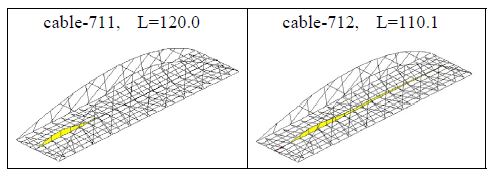
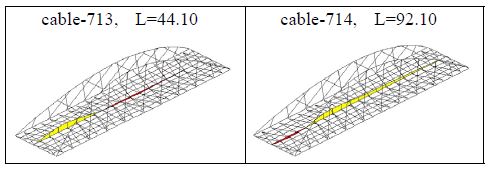
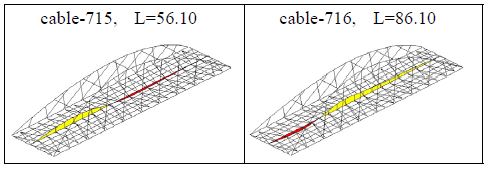
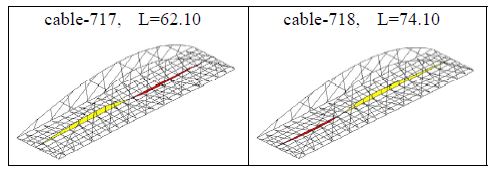
대상 교량 구조물 설계 시 케이블의 구조해석에 의한 영향선 해석과 케이블 장력 산정 값을 Table 7에 나타내었다. 또한 케이블은 부재에 대한 영향선해석 결과를 이용하여 충격계수를 적용하였을 때 케이블의 장력을 비교한 결과 차이는 허용오차 이내인 최대 1.10 % 이내이므로 평균치를 적용한다.
4.4 관리한계치 설정
식 (5)는 한계상태(limit state)방정식으로 관리한계치 설정을 위한 식이다(6).
즉 계측치가 관리한계치보다 커지는 경우를 한계상태로 정의하였다.
| (5) |
T관리한계 : 관리한계치
S : 케이블 장력 변수
각 케이블 장력에 대한 확률분포모형을 이용하여 관리한계치를 산정하기 위해 AFOSM기법에 의한 신뢰성 해석을 수행하였다. 한계상태 방정식에 대한 신뢰성 해석으로부터 각 신뢰성 지수에 해당하는 관리한계치를 산정할 수 있다. 그러나 β에 대응하는 관리한계치를 바로 결정하기가 어려우므로, T관리한계(장력 관리한계치)를 몇 개의 값으로 가정한다. 그 후 신뢰성이론을 바탕으로 해석을 수행하여 각 가정 값에 대한 신뢰성 지수를 구하고, 이를 회귀방정식에 이용하면 신뢰성 지수에 상응하는 관리한계치를 산출할 수 있다.
각 케이블에 대한 측정 자료로부터 Table 8과 같은 회귀방정식을 산출하였다.
대상교량의 관리기준치 설정은 크게 구조형상, 부재응력, 케이블장력, 구조진동, 외부하중에 대하여 설정하였다. 교량 설계 시 계산된 구조계산서 상의 설계값을 구조해석결과, 시공 중 모니터링 결과 및 초기 재하시험 결과와 비교 검토하여 대표값으로 설정하였고 대표값의 60 %값을 초과하는 경우 주의단계(1차 관리기준치), 대표값의 80 %값을 초과하는 경우 경고단계(2차 관리기준치), 대표값을 초과하는 경우 위험단계(3차 관리기준치)로 설정하였다. 그리고 구조계산서에 명시되지 않은 항목들은 시방서, 유사교량사례 등을 적절히 활용하여 관리기준치에 적용 하였다. 현재 설정된 관리기준치의 관리 단계는 Table 9와 같다.
여기서 추정된 회귀방정식을 이용하여 산정한 신뢰성 지수 β에 대하여 Table 10과 같은 관리기준치를 설정하였다.
5. 결 론
닐센아치교 케이블 장력관리를 위한 관리한계치 설정에 대해 기존의 방법에 대해 문제점을 분석하고 실제 닐센 아치교 대상 교량의 특성에 맞는 새로운 관리한계치 설정 방법을 제시하였다. 기존의 관리한계치는 설정방법에 대한 문제점은 다음과 같음을 보였다.
(1) 기존의 관리한계치 설정방법의 경우 최종도입장력을 기준치로 하여 기준이 되는 값보다 상회(%)하는 값을 기준으로 하여 관리한계치를 설정하였다.
그러나 이러한 주의치나 경고치 설정은 단지 경험적인 방법으로 유지관리자가 임의로 설정하는 경우가 대부분으로 각 계측 항목에 대하여 같은 편차량을 적용하여 관리한계치를 설정하는 것은 각 계측 항목의 특성을 무시한 것으로 불합리하다.
(2) 닐센 아치교의 모든 케이블에 대해 관리한계치 설정을 위해 동일한 할증률을 적용한 결과 어떤 케이블에 대해서는 관리한계치가 허용장력을 초과할 수 있어 관리한계치의 의미가 상실된다.
(3) 교량 구조물은 필연적으로 시간의 경과와 함께 열화가 진행 되며 이는 일반적으로 점진적 진행의 성격을 보이나 상황에 따라 급작스러운 열화의 진행을 보이기도 한다. 교량 구조물의 열화는 처짐을 발생시키고 이는 변형률의 증가를 야기한다. 즉, 관리한계치 설정 역시 교량의 거동에 대응하여 지속적으로 변화하여 설정되어야 한다.
(4) 실제 계측된 장력 값의 확률분포를 이용하여 각 케이블에 대해 기존에 설정된 관리한계치에 대한 신뢰성 지수를 산출한 결과 모든 케이블에 동일한 할증율을 사용하였으나 각 케이블은 각기 상이한 신뢰성 지수를 나타냈다. 따라서 기존의 관리한계치 설정방법에 의해 케이블 장력을 관리하는 경우 동일한 할증율을 적용한다고 할지라도 각 케이블에 대한 안전도를 알 수 없으며 각 케이블 마다 각기 상이한 안전도로 관리되는 결과를 초래하였다.
향후 U-네트워크 모니터링 시스템을 발전시키기 위하여 UFID(unique feature identifier) 기술 적용, GIS 3D 기술 도입, 지자체 및 관련기관의 유기적인 협조등 기존 시설물 관리 체계에 적용된 기술들과의 연계방안이 시급하고 그에 따른 연구 투자가 있어야 할 것이다. 그리고 기존의 유지관리 시스템의 정보관리체계 분석 및 유비쿼터스 기술 적용을 통하여 단순한 모니터링 수치정보의 습득이 아닌 자동화 되고 실시간으로 정보를 관리하여 유지관리 정보 켄텐츠의 유비쿼터스 기술기반에 적용을 도모하여야 할 것이다.
References
- Jeong, S. G., Lee, S. and Shim, T. S., 1999, Analysis of Reliability for Management Standards for Retaining Structures Applied in Korea, Journal of the Korean Society of Civil Engineers, Vol. 19, No. I-3, pp. 479~487.
- Kang, K. G., 2005, A Study on Setting Management Limits for Cable Tension Management of Cable-stayed Bridges Based on Reliability, pp. 37~56. Doctoral Dissertation, Hanyang University Graduate School, Korea.
- Kim, N. S., Bin, J. M. and Chang, S. J., 2006, Back Analysis for Estimating Tension Force on Hanger Cables, Proceedings of the KSNVE Annual Spring Conference, p. 782.
- Sin, J. H., Park, J. S., Lee, M. K., Kim, S. H. and Hwang, H. J., 1993, Study on the Tension Measurement of the Cable, Proceedings of the KSCE Conference, pp. 292~295.
- An, S. S., Kim, M. H. and Kim, I. B., 2001, Study on the Calculation of Tension of Cable-stayed Bridge in Seohae Bridge by Constant Vibration Measurement, Proceedings of the KSCE Conference, pp. 1~4.
- Kang, K. K., 2005, Study on the Determination of Reliability-based Critical Timeshold Value for Management of Cable Tension Force in Cable-stayed Bridge, pp. 37~56, Doctoral Dissertation, Hanyang University Graduate School, Korea.
-
Irvine, H. M. and Caughey, T. K., 1974, The Linear Theory of Free Vibrations of a Suspended Cable, Proceedings of the Royal Society of London: Series A, Vol. 341, pp. 299~315.
[https://doi.org/10.1098/rspa.1974.0189]

-
Shimada, T., 1994, Estimating Method of Cable Tension from Naturl Frequency of High Mode, Journal of Japan Society of Civil Engineers, Vol. 501, No. I-29, pp. 163~171.
[https://doi.org/10.2208/jscej.1994.501_163]

-
Triantafyllou, M. S., 1984, The Dynamics of Taut Inclined Cables, Quarterly Journal of Mechanics and Applied Mathematics, Vol. 37, No. 3, pp. 421~440.
[https://doi.org/10.1093/qjmam/37.3.421]

-
Kang, M. S., 2018, Real Time Estimation of Cable Tension from Transverse Vibration Measurement, Proceedings of the KSNVE Annual Autumn Conference, p. 126.
[https://doi.org/10.5050/KSNVE.2018.28.1.125]


In ki Moon is Housing Land Development Office of Jeonnam Development Corp, currently a Ph.D. Chosun University Civil Engineering student. His research interests are noise and vibration and cable vibration.

Sun Min Choi received his Ph.D. in Civil Engineering Chonnam National University, Gwangju, Korea From 2019 to 2021. he is currently Department Adjunct Professor, Dongshin University, Department of Civil Engineering, Analysis of Noise and Vibration and Cable Tension.

Du San Kim is currently a Ph.D. student in the Department of Civil Engineering, Chosun University. His research interests are noise and vibration and cable vibration.

