An Analysis on Comprehensive Vibration Assessment Program for APR1400 Reactor Vessel Internals
‡ Recommended by Editor Jun hong Park
© The Korean Society for Noise and Vibration Engineering
Abstract
The U.S. Nuclear Regulatory Commission Regulatory Guide 1.20 requires a comprehensive vibration assessment program to verify the structural integrity of the reactor vessel internals of newly constructed nuclear power plants for flow-induced vibrations. The comprehensive vibration assessment program mainly comprises analysis, measurement, and inspection programs. This paper performs a flow-induced vibration evaluation of the structural integrity of the APR1400 reactor vessel internals by reviewing the analysis, measurement, and visual inspection results obtained at the Shin-Kori Unit 4 nuclear power plant. As the analysis data were predicted to be conservatively higher than the measurement data, it was confirmed that the analysis methodology was developed properly. As the predicted maximum stresses of the reactor vessel internals were lower than the allowable stress and the inspection results showed no indication of defects, the structural integrity of the APR1400 reactor vessel internals was verified.
초록
미국 원자력규제위원회 규제지침 1.20은 원자로 냉각재의 유동유발진동에 의한 신규 건설원전의 안전성 확인을 위해 원자로 내부구조물 종합진동평가를 요구한다. 원자로 내부구조물 종합진동평가는 해석, 측정 및 검사로 구성된다. 이 논문은 신고리4호기 원자로 내부구조물 종합진동평가를 수행한 결과에 근거하여 APR1400 원자로 내부구조물의 구조적 건전성을 확인한 것이다. 유동 및 구조 해석결과는 측정결과보다 크게 보수적으로 예측되어 수립된 해석방법론은 적절하게 개발되었다. 또한, 해석된 최대응력은 허용응력보다 낮게 나타났으며 검사결과 어떠한 결함도 나타나지 않아 APR1400 원자로 내부구조물의 구조적 건전성을 확인하였다.
Keywords:
APR1400, RVI, CVAP, Flow-induced Vibration, Stress and Vibration키워드:
신형경수로1400, 원자로 내부구조물, 종합진동평가, 유동유발진동, 응력 및 진동1. Introduction
The U.S. Nuclear Regulatory Commission regulatory guide (NRC RG) 1.20 requires a comprehensive vibration assessment program (CVAP) for the reactor vessel internals (RVI) before commercial operation of nuclear power plants (NPP). The CVAP should evaluate the structural integrity of the RVI for steady-state and anticipated transient conditions that correspond to preoperational, startup test, and normal operating conditions(1). The CVAP consists of the vibration and stress analysis program, the vibration and stress measurement program, and the inspection program. The vibration and stress analysis program is to verify theoretically the structural integrity of the RVI and to provide the basis for selecting the locations monitored in measurement and inspection programs(2). The analysis program predicts the hydraulic loads inducing structural vibration of the RVI and the responses of the internals. The objective of the vibration and stress measurements program is to obtain sufficient data to confirm predictions at operating conditions of steady state and transient. This confirmation requires the measurement data related to both the hydraulic loads and the dynamic responses of the RVI(3). The inspection program checks the integrity of the stress concentration areas and vulnerable parts after the hydraulic vibration(1). NRC RG 1.20 requires programs such as analysis, extensive measurement, limited measurement, or full inspection according to the RVI configuration. We, Korea Hydro & Nuclear Power Co. Ltd. (KHNP), conducted the CVAP for the APR1400 RVI as a non-prototype category II consisting of analysis, limited measurement, and full inspection to independently verify the structural integrity of the RVI even if the APR1400 RVI were licensed as a non-prototype category I consisting of analysis and full inspection. The inspection and measurement of the CVAP for the APR1400 RVI was performed from January 2016 to December 2016 at Shin-kori (SKN) unit 4 NPP.
This paper describes the results of evaluation on analysis, measurement, and inspection programs for the APR1400 RVI. In analysis program, we predicted deterministic and random hydraulic loads as the nature of the loads and two types of structural responses caused by those hydraulic loads. The hydraulic loads in the internals and dynamic responses were also measured and the measured data were compared with predicted data to confirm the validity of the analysis results. After the internals had experienced sufficient flow-induced vibration, the internals were inspected to detect evidence of excessive motion.
2. Comprehensive Vibration Assessment Program
2.1 Vibration and Stress Analysis Program
The vibration and stress analysis program consists of hydraulic load analyses and structural response analyses. The program was performed before hot functional test of SKN unit 4 NPP and was performed additionally to reflect the measurement results after the vibration and stress measurement.
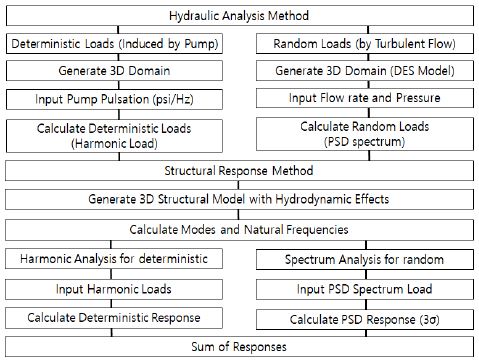
The hydraulic loads include the deterministic hydraulic loads caused by the pump pulsation and the random hydraulic loads induced by the turbulent flow. The deterministic loads and the random loads are assumed to be caused by independent sources. Therefore, those hydraulic loads can be calculated separately(2,4~8). Fig. 1 shows the method of hydraulic and structural analysis(2,4~8).
The deterministic hydraulic load is due to the pulsations caused by the reactor coolant pumps. The pulsations propagate through the RVI as acoustic waves, independent of fluid velocity. The pulsations also occur at multiples of the rotor revolution frequency (20 Hz) and the blade passing frequency (120 Hz) of the reactor coolant pump. Therefore, the deterministic hydraulic loads were predicted with acoustic analysis for 6 frequencies (20 Hz, 40 Hz, 120 Hz, 240 Hz, 360 Hz and 480 Hz). The structural response analysis to the deterministic hydraulic loads was performed with the spectrum response analysis for the 6 frequencies. The total deterministic response was combined by the square root of the sum of squares (SRSS) method(2,4,5,9~11).
The random hydraulic loads are due to the turbulent flow in the reactor vessel and were predicted with computational fluid dynamics in our study. Since random nature of the turbulence, a statistical method was used to define both the magnitude and frequency of the turbulence. Therefore, power spectral density (PSD) was used for both the random hydraulic load analysis and the structural response analysis. The flow except for the nearly stagnant flow in the upper guide structure (UGS) was selected as a turbulence analysis scope in the reactor vessel, because the bypass flow of the APR1400 reactor vessel is less than 3 % of total coolant flow and the flow in the inner barrel assembly (IBA) is too expensive to simulate. Natural frequencies and mode shapes of the RVI were calculated with block Lanczos method which is used a lot in commercial structural analysis programs and the spectrum analysis was used for the structural response analysis. The frequency range of the analysis was up to 500 Hz and the scale of the analysis results was 3-sigma. The hydrodynamic mass was considered, since the RVI are submerged by the coolant. Therefore, the added mass for each internal was calculated according to ASME B&PV Section III Appendix N(2,4,6,9,10,12).
The analysis and test conditions of SKN unit 4 RVI CVAP presented in prior Ko’s papers(3,13), which are composed of 18 conditions based on the operation configurations of the pumps, operating pressures and temperatures. The transient state in the test conditions of the RVI CVAP corresponds to the start and stop of the reactor coolant pump. Since the hydraulic loads on the transient state do not give substantial effect on the results of the structural analysis in comparison with the loads on the steady state, the greater hydraulic load of the steady states before/after the transient was used(8).
2.2 Vibration and Stress Measurement Program
The vibration measurement program includes a data acquisition and reduction system as well as test conditions, consistent with the SKN unit 4 general guidelines for the vibration measurement program delineated in the US NRC RG 1.20 for prototype RVI. This program incorporates appropriate instrumentation to define the hydraulic loads and the responses of the internals that have been modified relative to the valid prototype, and demonstrates that the test acceptance criteria have been satisfied. In addition, the measurement program incorporates sufficient and appropriate instrumentation to monitor those RVI components that have not been modified relative to the valid prototype(1).
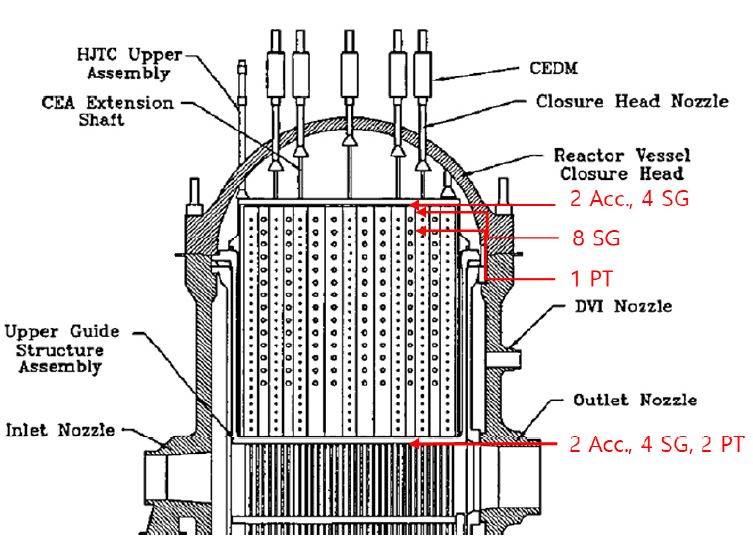
The vibration measurement program for the APR1400 RVI consists of twenty-three sensors (twenty-three data channels) located on the UGS assembly. In detail, two accelerometers (ACC.) and four strain gages (SG) for the IBA top plate, eight strain gages and one pressure transducer (PT) for the control element assembly (CEA) shroud assembly, and two accelerometers, two pressure transducers, and four strain gages for the UGS were installed as shown in Fig. 2(3,13~17).
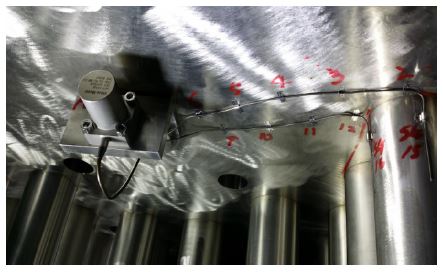
The installation locations of the sensors were selected to provide, to the extent possible, data comparable to those from the measurement and inspection programs for Palo Verde 1 and OPR1000. There were restrictions on the APR1400 measurement program, however, which resulted from the necessity to minimize the risk of damage to the internals during site installation of the sensors and their leads, and hardware to protect them from flow-induced vibrations during the pre-core hot functional test (HFT)(8,13). Fig. 3 shows two strain gages welded on a CEA guide tube and an accelerometer installed on the UGS support plate.
The measurement for the APR1400 RVI was performed from April 13, 2016 through May 18, 2016. Although fifteen hard-lines for strain gages were unfortunately damaged and their data were not able to be acquired, the measurement for one strain gage (SG12), three pressure transducers, and four accelerometers for the APR1400 CVAP were carried out as a measurement procedure and the useful data were able to be acquired(13).
2.3 Vibration and Stress Inspection Program
The inspection program follows the related guidelines delineated in the US NRC RG 1.20 for a prototype RVI. The NRC RG 1.20 requires that the non-prototype RVI components be subjected to at least 1.0E6 cycles of vibration before the final inspection of the RVI. The minimum time duration of the hydraulic loads applied to the RVI was decided by the first natural frequency of the CSB. Therefore, the inspection program consists of a comparison of data gathered during the baseline (pre-HFT) inspection and data gathered during the post-HFT inspection to determine conformance with the acceptance criteria. The inspection program was performed for the high stressed areas of the RVI and interfaces between internals. The RVI to be inspected were a core support barrel, an in-core instrument support structure, a lower support structure, a core shroud, CEA guide tubes, a UGS barrel, a CEA shroud, an IBA, a hold-down ring, a reactor vessel, and a reactor vessel closure head. The baseline inspection for the APR1400 CVAP was conducted from January 4, 2016 to January 16, 2016 and the post-HFT inspection was conducted from December 9, 2016 to December 20, 2016(18).
2.4 Comparison of Predicted and Measured Data
The comparisons of predictions and measured data were done for the IBA top plate, the CEA shroud assembly, and the UGS. The test conditions selected for evaluation were representative test cases, consisting mostly of operating conditions which provided the larger loading conditions for evaluation.
There are two hydraulic loads of interest: the pump-induced pressure pulsations and the random turbulence pressures. Table 1 and Table 2 presents the comparisons between predicted and measured pump-induced pressure pulsations at the pump forcing frequencies and rotor revolution frequencies for several test cases. As shown in Table 1, the measured pump-induced RMS (root mean square) pressure pulsations are very small for the pump forcing frequencies of 20 Hz, 40 Hz, 120 Hz, 360 Hz, and 480 Hz. The maximum RMS pressure pulsations measured at 0.077 psi at 240 Hz in the test condition 14 as 0.077 psi. The maximum measured total deterministic load also shows 0.077 psi in the test condition 14 too, and the maximum predicted RMS pressure presents 0.761 psi in the test condition 15. Although the measured data are higher than the predicted values in some test conditions, the total measured pump-induced RMS pressures are higher than the predicted pressures. In general, the total measured pump-induced RMS pressures are smaller than predicted those by approximately one order of magnitude or more for the locations PT1 within the CEA shroud assembly. From Table 2, the pump-induced RMS pressure pulsations for frequencies of 20 Hz, 40 Hz, 120 Hz, 360 Hz, and 480 Hz are very small. The highest measured RMS pressure occurred at 240 Hz. The maximum RMS pressure at 240 Hz in the test condition 16 was 0.143 psi. The maximum measured total deterministic load also shows 0.143 psi in the test condition 16 too, and the maximum predicted RMS pressure presents 2.12 psi in the test condition 14 and 16. In general, the measured values for pump-induced pressure pulsations are substantially smaller than the predicted values, especially at 240 and 480 Hz forcing frequencies.
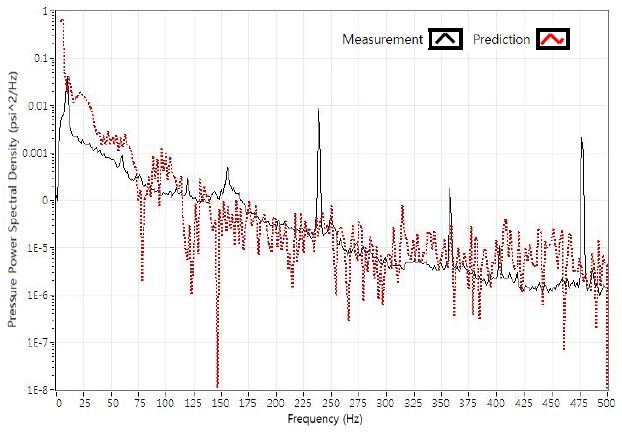
For random turbulence pressure in the UGS support plate region, Fig. 4 shows comparisons of predictions versus measurements on location PT3 for the test condition 18(19). The figure indicates that the predicted PSD trend matches or envelopes the measured random turbulence pressure. Meanwhile, we do not compare the measured values with the predicted values for random hydraulic loads inside the UGS in this paper, because the flow in the CEA shroud assembly isn't the main flow of reactor coolant and so the flow wasn’t predicted with CFD. Also due to the reason, the conservative hydraulic loads among the hydraulic loads predicted on the UGS support plate were used for the structural analysis of the CEA shroud assembly.
The total hydraulic loads predicted and measured are shown in Table 3. Comparing Table 3 to Table 1 or Table 2, the deterministic hydraulic loads are generally smaller than the random hydraulic loads. The hydraulic loads (PT1) in the CEA shroud assembly were measured to be considered even if the flow in the CEA shroud assembly isn't the mainstream. The predicted values are generally larger than the measured values. However, the random hydraulic loads used for the structural response analysis of the CEA shroud assembly need to be applied more conservatively for the test condition 1 ~ 4.
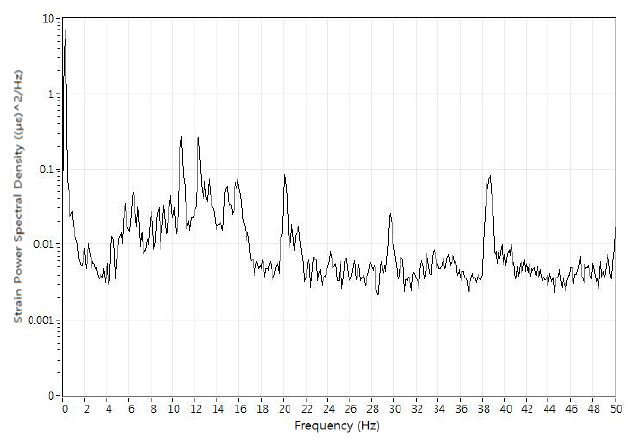
Table 4 show the natural frequencies of the CEA shroud assembly predicted from the first to the fifth mode. Fig. 5 shows measured strain PSD distribution in narrow band of the SG12 in the test condition 6.
This plot shows peaks at approximately 29.5 Hz, as com-pared to the predicted value of 30.8 Hz (126.7℃, test condition 6). However, several peaks are observed at frequencies different from the natural frequencies in Fig. 5. Those frequencies are about 10.5 Hz, 12.2 Hz, 14.7 Hz, 20 Hz, and 38.5 Hz. Similar results were seen in other test conditions. strain PSD distribution in narrow band at SG12 in test condition 6.
The frequency ranges for those peaks are 10.5 Hz ∼ 11.5 Hz, 12 Hz ∼ 13.5 Hz, 14.5 Hz ∼ 17 Hz, 20 Hz ∼ 22 Hz, and 38.5 Hz ∼ 39.5 Hz. The peaks of 20 Hz ∼ 22 Hz and 38.5 Hz∼ 39.5 Hz are judged to be from the deterministic hydraulic loads. For the other peaks, it is estimated that the responses of the UGS and the CSB have an effect on the CEA shroud assembly, since the CEA shroud assembly is welded to the UGS assembly and is fixed with the CSB assembly by alignment keys, or those peaks can be generated by rigid body motion induced by fluid coupling between the UGS assembly and the CEA shroud assembly.
The total RMS responses of the UGS assembly in the SKN unit 4 RVI CVAP tests and the responses of the internals in the analysis are shown in Table 5. The responses of the UGS assembly to the deterministic and random hydraulic loads are the results of structural responses of entire UGS assembly as well as of individual components such as the UGS barrel, the UGS support plate, the IBA barrel, the IBA top plate, the CEA guide tubes, the CEA shroud tubes, and the CEA shroud webs. The structural responses of the UGS assembly were measured by the strain gages and the accelerometers. From Table 5, it is clear that the measured responses in the UGS assembly are generally lower than predicted values. The maximum strain was measured by the SG12 in the test condition 11 at 7.17 με (micro-strain) RMS. This is smaller than the maximum predicted value of 9.92 με. The maximum measured displacement is 4.54 mils for the IBA top plate (A1) in the test condition 14. This is lower than the predicted value of 36.9 mils RMS in the test condition 15. The maximum measured displacement of the UGS support plate (A4) is 4.28 mils in the test condition 16. This is smaller than the predicted value of 15.6 mils in the test conditions 10 and 11. This shows that the response analysis for the UGS assembly was performed conservatively. Unlike the measurement, the predicted displacements of the A1 are much larger than those of the A4. This is due to very conservative hydraulic load input method used for the structural response analysis for the IBA top plate.
3. Discussion
The measured deterministic hydraulic loads were significantly less than predicted deterministic loads for the UGS and the CEA shroud assembly, and the measured random hydraulic loads were mostly lower than the predicted random loads. The measured natural frequencies agreed well with predicted natural frequencies in all internals for the CVAP in this study.
The measured strains on the CEA shroud assembly were mostly smaller than calculated those in the structural analysis and much smaller than the acceptance criteria (165 με(20)). Meanwhile, the predicted displacement for the IBA top plate (A1) were much higher the measured data.
This is due to the assumption that random hydraulic loads act only to bottom of the IBA top plate conservatively in the structural response analysis of the IBA top plate. The predicted displacements for the IBA top plate and the UGS assembly were higher the measured data respectively. After comparing the analysis results with the measurement results, we performed the random response analyses additionally since it has been found that the random hydraulic loads for some structures have not been calculated conservatively compared to the measured loads.
Table 6 shows the predicted maximum stress intensity in the CVAP conditions for the APR1400 RVI and the allowable stress from ASME Boiler and Pressure Vessel Code, Section III, Division 1 - Appendices, Fig. I-9.2, design fatigue curve(21). Since the predicted hydraulic loads and structural responses for the APR1400 RVI mostly shows conservative results and the maximum stresses of the RVI are lower than the allowable stress, it means that the structural integrity of the RVI was con-firmed for flow-induced vibration.
The inspection of the RVI was performed after sufficient hydraulic vibration. After the completion of pre-core HFT, the overall external views of the RVI surfaces were throughout the metallic charcoal color. Most of close views revealed that components were more gold / bronze in colors and coated with dusty powders of the charcoal color. It is judged that the stainless steel would change color after being exposed to the high temperature associated with HFT. There was also no loose part, debris or excessive motion of the RVI during the HFT(18).
Moreover, the inspection results showed no evidence of damage to the instrumentation or supporting hardware installed for the RVI CVAP. Therefore, it is confirmed that the results of visual inspection are consistent with the results of the analysis and measurement program.
4. Conclusions
We had completed the comprehensive vibration assessment program for the APR1400 reactor vessel internals with the analysis, inspection, and limited measurement based on the U.S NRC regulatory guide 1.20, Rev. 2. The measurement and inspection program were performed during pre-core hot functional test at Shin-kori unit 4 nuclear power plant. The prediction, measurement and inspection results were compared and evaluated. It is confirmed that the analysis results were higher than measurement results and the maximum stresses of the reactor vessel internals for flow-induced vibration were lower than the allowable stress. Moreover, there was no evidence of damage of the internals in the visual inspection. Therefore, we verified that the APR1400 reactor vessel internals have structural integrity for flow-induced vibration and are acceptable for long term operation.
Acknowledgments
This R&D was supported by Korea Hydro & Nuclear Power Co., Ltd., Korea.
References
- U.S. Nuclear Regulatory Commission, 1976, Comprehensive Vibration Assessment Program for Reactor Internals during Preoperational and Initial Startup Testing, Regulatory Guide 1.20(Rev.2), Washington, D.C.
-
Kim, K. H., Ko, D. Y. and Kim, S. H., 2013, Validation of Vibration and Stress Analysis Method for APR1400 Reactor Vessel Internals Comprehensive Vibration Assessment Program, Transactions of Korean Society for Noise and Vibration Engineering, Vol. 23, No. 4, pp. 308~314.
[https://doi.org/10.5050/KSNVE.2013.23.4.308]

-
Ko, D. Y. and Kim, K. H., 2013, Design of a Vibration and Stress Measurement System for an Advanced Power Reactor 1400 Reactor Vessel Internals Comprehensive Vibration Assessment Program, Nuclear Engineering and Technology, Vol. 45, No. 2, pp. 249~256.
[https://doi.org/10.5516/NET.09.2012.049]

- Kim, K. H., Ko, D. Y. and Kim, T. S., 2014, Overview for the Analysis Methodology of Reactor Vessel Internals Comprehensive Vibration Assessment Program, Proceedings of the KSNVE Annual Spring Conference, pp. 297~299.
- Kim, K. H., Kim, Y. S. and Gu, J. Y., 2011, Deterministic Hydraulic Load Analysis on Reactor Internals of APR1400, Transactions of the Korean Nuclear Society Spring Meeting, pp. 26~27.
- Kim, K. H., Ko, D. Y. and Kim, T. S., 2011, Hydraulic and Structural Analysis for APR1400 Reactor Vessel Internals against Hydraulic Load Induced by Turbulence, International Journal of Safety, Vol. 10, No. 2, pp. 1~5.
- Combustion Engineering Inc., 1985, A Comprehensive Vibration Assessment Program for Palo Verde Nuclear Generating Station Unit 1 (System 80 Prototype), CEN-263(V)-P(Rev.1-P.).
- KEPCO, 1995, A Comprehensive Vibration Assessment Program for Yonggwang Generating Station Unit 4 Final Evaluation of Pre-core Hot Functional Measurement and Inspection Programs, 10487-ME-TE-240-03(Rev. 0), Korea.
-
Ko, D. Y. and Kim, K. H., 2011, Structural Analysis of CSB and LSS for APR1400 RVI CVAP, Nuclear Engineering and Design, Vol. 261, pp. 76~84.
[https://doi.org/10.1016/j.nucengdes.2013.03.012]

-
Ko, D. Y. and Kim, K. H., 2012, Vibration and Stress Analysis of a UGS Assembly for the APR1400 RVI CVAP, Nuclear Engineering and Technology, Vol. 44, No. 7, pp. 817~824.
[https://doi.org/10.5516/NET.09.2011.057]

- Kim, K. H., Ko, D. Y. and Kim, S. H., 2013, Structural Response Analysis on APR1400 Core Support Barrel according to Operation Conditions of Reactor Coolant Pump, Proceedings of the KSNVE Annual Spring Conference, pp. 581~582.
- Kim, K. H., Ko, D. Y. and Kim, T. S, 2013, Detail Structural Analysis on OPR1000 Core Support Barrel, Proceedings of the KSNVE Annual Autumn Conference, pp. 402~403.
-
Ko, D. Y. and Kim, K. H., 2018, Measurement of Vibration and Stress for APR-1400 Reactor Internals, Nuclear Engineering and Technology, Vol. 50, No. 6, pp. 963~970.
[https://doi.org/10.1016/j.net.2018.04.012]

- Ko, D. Y. and Kim, K. H., 2013, Comprehensive Vibration Assessment Program Measurement Test Plan for Advanced Power Reactor 1400, Proceedings of the KSNVE Annual Spring Conference, pp. 589~595.
-
Ko, D. Y., Kim, K. H. and Kim, S. H., 2012, Structural Analysis and Response Measurement Locations of Inner Barrel Assembly Top Plate in APR1400, Transactions of Korean Society for Noise and Vibration Engineering, Vol. 22, No. 5, pp. 474~479.
[https://doi.org/10.5050/KSNVE.2012.22.5.474]

- Ko, D. Y., Kim, K. H. and Kim, S. H., 2012, Selection of Measurement Locations at Inner Barrel Assembly Top Plate in the Reactor, Proceedings of the KSNVE Annual Spring Conference, pp.734~738.
-
Ko, D. Y., Kim, K. H. and Kim, S. H., 2013, Structural Analysis and Measuring Locations of Upper Guide Structure Assembly in APR1400, Transactions of Korean Society for Noise and Vibration Engineering, Vol. 23, No. 1, pp. 49~55.
[https://doi.org/10.5050/KSNVE.2013.23.1.049]

- Doosan Heavy Industries, 2017, Final Evaluation Report of Field Inspection for Comprehensive Vibration Assessment Program for Shin-Kori Nuclear Power Plant Unit 4, HD-121TE-002(Rev. 0), Korea.
- Kim, K. H. and Ko, D. Y., 2019, Comprehensive Vibration Assessment Program for APR1400 Reactor Vessel Internals, Proceedings of the KSNVE Annual Autumn Conference, p. 364.
-
Ko, D. Y., Kim, K. H. and Kim, S. H., 2011, Response Instrumentation Test Acceptance Criteria for APR1400 RVI CVAP, Transactions of Korean Society for Noise and Vibration Engineering, Vol. 21, No. 11, pp. 1036~1042.
[https://doi.org/10.5050/KSNVE.2011.21.11.1036]

- American Society of Mechanical Engineers, 2010, ASME Boiler and Pressure Vessel Code, Section III, Division 1–Appendices, New York.

Kyu-Hyung Kim received Master in mechanical engineering from Chungbuk National University in 1998. He is a senior researcher at Korea Hydro & Nuclear Power Company - Central Research Institute (KHNP-CRI). His research interests include vibration and stress analysis for nuclear reactor vessel and steam generator internals.

Do-Young Ko received the M.S. and Ph.D. degrees in Electrical and Computer Engineering from University of Seoul, Korea in 2003 and 2007, respectively. He has studied as a senior researcher in Korea Hydro & Nuclear Power Company - Central Research Institute (KHNP-CRI) since 2003. His main research interests are verification and validation of reactor design (reactor internals modularization, comprehensive vibration assessment), wireless technology, and digital instrumentation and control for nuclear power plants.
