Comparison of Acoustic Radiation Characteristics in the Near and Far Fields Due to the Vibration of a Circular Disk Placed on an Infinite Rigid Baffle Using the Rayleigh Integral Method and Lumped Parameter Method
© The Korean Society for Noise and Vibration Engineering
Abstract
The sound pressure measured at the near field exhibits significant fluctuation depending on the size and frequency of the sound source. Therefore, it is necessary to use the sound pressure measured or numerically calculated at a sufficient distance from a radiator to estimate the actual sound power of the source. In this study, we investigated the appropriate distance for measuring or numerically calculating the sound pressure to validly estimate the sound power of a radiator, which depends on the frequency. A theoretical estimation of the starting position of the far-field acoustic characteristics for rigid disk vibrations was conducted, and the results were numerically compared and reviewed using the Rayleigh integral method (RIM) and lumped parameter method (LPM). The analysis using these methods, with modeling based on the 1/3 wavelength rule, demonstrated accurate predictions of the near-field acoustic characteristics. It was shown that the near sound field could be accurately predicted by modeling and analyzing under the condition of the 1/3 wavelength rule using the RIM and LPM. It was found that even when elements were modeled at a larger size than the 1/3 wavelength rule, the far-field sound pressure result could effectively depict the theoretical far-field sound pressure in the case of the RIM. It was also shown that the sound pressure due to the vibration of a flexible circular disk modeled with an element size based on the 1/3 wavelength rule was well predicted by both the LPM and RIM.
근거리에서 측정된 음압은 음원의 크기와 주파수에 따라서 변동성이 크므로 방사체와의 거리가 충분히 떨어져서 측정 또는 수치적으로 계산된 음압을 사용해야 방사체의 실제의 음향 파워를 추정하는데 사용할 수 있다. 본 논문에서는 음향 파워를 추정하는데 필요한 원거리 음압은 주파수에 따라 어느 정도 거리 이상에서 추정해야 타당한지를 기술하였다. 원판의 강체 진동에 대한 원거리 음장 특성의 시작 위치를 이론적으로 추정하였고, 이를 Rayleigh integral method와 lumped parameter method를 사용한 수치적 해와 비교 검토하였다. RIM 뿐만 아니라 LPM을 이용하여 파장의 1/3 rule 크기로 모델링하여 해석하면 근거리 음장 특성도 정확히 예측할 수 있음을 나타냈다. 파장의 1/3 rule 보다 큰 크기로 모델링 하여도 원거리 음장에서의 음압 특성은 RIM의 경우에 이론적인 원거리 음압을 잘 표현할 수 있음을 보였다. 파장의 1/3 rule에 따라 요소 크기로 모델링한 원형 디스크의 유연체 모드 진동으로 방사된 음압은 LPM과 RIM에서 둘 다 잘 예측됨을 보였다.
Keywords:
Fresnel Diffraction Effects, Far Field Pressure, Near Field Pressure, Lumped Parameter Method, Rayleigh Integral Method키워드:
프레넬 회절 효과, 원거리 음압, 근거리 음압, 집중 매개변수 방법, 레일리 적분 방법1. Introduction
Indeed, the demand extends beyond analyzing vibrations in three-dimensional (3D) structures; it includes predicting acoustic radiation arising from the vibrations of two-dimensional (2D) structures. Anticipating sound radiation is necessary for flat structures positioned on wide panels or thin plate structures within arbitrary sections of three-dimensional space. For example, acoustic radiation caused by vibration in a part of a vehicle door panel, acoustic radiation analysis from a wall-mounted flat-panel TV speaker in a room, etc. can be seen as areas where acoustic analysis of two-dimensional structures is required.
Finite element method (FEM) and boundary element method (BEM) have been widely used as numerical analysis methods to predict sound pressure radiated by vibration of a flat plate placed on an infinite rigid baffle. They model the target object to be analyzed and the area of interest using elements. Once the frequency of interest for analysis is determined, the wavelength corresponding to that frequency is calculated. The size of the largest side of elements to be used in modeling must be modeled smaller than 1/3 or 1/6 of the wavelength to be analyzed to obtain reliable analysis results. FEM is a domain analysis method. To perform 3D acoustic analysis, all 3D domain of interest including the target object and the surrounding region where the sound pressure is to be calculated are modeled using 3D elements and a numerical solution is obtained. If the domain of interest changes, all 3D domain, including the target object and the changed domain of interest, are remodeled and analyzed at once, so many elements and nodes are used, and the calculation time can be needed very long. Acoustic BEM models only the surface of the analysis object, so the number of elements used is relatively small compared to FEM, but the system matrix is asymmetric and dense, so it requires a lot of memory. Therefore, it is known that analysis is possible only in the mid- and low-frequency range. Meanwhile, in BEM, only the values on the surface of the target object are analyzed, and the sound pressure in any area of interest can be calculated using this analysis result. In other words, even if the area of interest changes, it is a field analysis method that allows re-analysis only in the area of interest rather than recalculating the value on the surface of the object from the beginning. Since calculations can be made for arbitrary nodes in the field of interest, the sound pressure in the field of interest can be calculated quickly even if the field of interest grows or changes. When performing acoustic analysis based on plate vibration on an infinite baffle, the Rayleigh Integral Method (RIM), a simplified BEM, can be used(1~3).
Meanwhile, another method for analyzing acoustic radiation is the lumped parameter method (LPM)(3~5). LPM models only the surface of the object in the same way as BEM, making modeling easy. In addition, acoustic radiation analysis using thin flat plate edges in space are also possible(4), so it can be considered to be more useful than BEM. BEM can use velocity, sound pressure, and specific acoustic impedance boundary conditions, but LPM uses only volume velocity boundary conditions as boundary conditions. The main purpose of the LPM analysis method is known to predict the radiated acoustic sound power output of a target object rather than predict sound pressure at a short distance, so it is mainly interested in acoustic characteristics at a long distance(4).
On the other hand, when analyzing the acoustic characteristics of a microspeaker mounted on a mobile phone using numerical analysis, do the sound pressure characteristics analyzed at a close distance, for example, about 0.1 m, show inappropriate results because they fluctuate significantly depending on the near field characteristics? That is, does the theoretically predicted sound pressure match the numerically calculated sound pressure well in the fluctuating near field or the far sound field? In the case of a horn loudspeaker, will the results analyzed at 0.1 m distance from the horn mouth show different acoustic characteristics than the experimentally measured results? The motivation for this paper can be summarized as follows: (1) When conducting a theoretical analysis of the acoustic radiation characteristics of a flat plate placed on a rigid baffle that occurs when it vibrates, how much difference is there between the acoustic properties in the near field and the far field? In other words, when the vibration frequency of the panel is determined, where can we say that the far field begins? It is a critical problem. The acoustic power of a radiator can be obtained by multiplying the sound pressure value measured at a sufficiently far distance from the radiator by the area related thereto. In order to accurately predict the acoustic sound radiation power of a target object at a specific frequency, must we use the calculated or actually measured sound pressure at a certain distance from the radiating surface to use it as data to calculate the realistic acoustic power of the object? In conclusion, in order to estimate the acoustic power at a specific excitation frequency, at least how far away from the radiator should the sound pressure be measured or numerically analyzed? (2) To what extent do the numerical analysis results using RIM and LPM differ from the theoretical near field and far field analysis results depending on the element sizes used in modeling? (3) When performing BEM numerical analysis, the size of the largest side of elements is applied according to the 1/3 rule or 1/6 rule of the wavelength size to be analyzed. Even in LPM, how accurate results can be obtained according to this rule in analyzing near field or far field sound fields? LPM has been known to be a technique specialized for sound power prediction, but can it be considered valid for use in sound pressure prediction even in the near field? How well can LPM accurately predict sound pressure and can it also be used for near field prediction? In section 2, the acoustic radiation theory of circular panel on an infinite baffle plate is briefly described. Additionally, RIM and LPM were also described. In section 3, the acoustic radiation analysis process of circular panel was described. In section 4, the acoustic analysis results were compared and reviewed. In section 5, the limitations and usefulness of the method used are described as a conclusion.
2. Acoustic radiation by a finite-sized plate on an infinite baffle
2.1 Acoustic radiation theory of circular disk
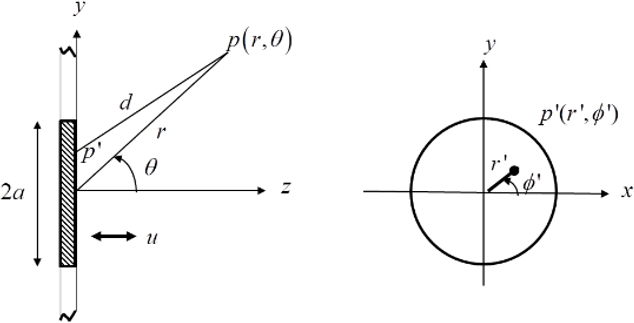
The far field sound pressure generated at a disk with a radius, a, vibrates on an infinite rigid baffle can be theoretically obtained as followed(6,7). In Fig. 1, when the area element dS at point p' vibrates at a volume velocity dU and considering image source, the sound pressure at point p is followed as Eq. (1).
| (1) |
Where, dU = usS, dS = r'dϕdr'
| (2) |
In Fig. 1, the distance d between point p' on the disk and point p in space is given by Eq. (3).
| (3) |
If we consider the far field sound pressure in case of r > > r', and the far field sound pressure is followed as Eq. (4).
| (4) |
For θ ≈ 0, far field pressure pfar field is expressed like as Eq. (5)
| (5) |
When the observation point p is on-axis, the far field condition is such that when r' changes on the disk, the variation of d is induced a phase change according to the volume velocity dU position, resulting in acoustic cancellation at the observer's position. When using the approximation of the exponent component in Eq. (2), the condition for reducing the effect of acoustic cancellation due to phase change is that the variation of d should be less than λ/16(6). When r' is at the origin, d becomes the minimum value dmin = r, and when r' is on the circumference, d becomes the maximum value and the path difference must satisfy dmax - dmin = a2/(2r) < λ/16.
In other words, when the far field on-axis condition is set to θ = 0, r → z like as Eq. (6),
| (6) |
If it is expressed in terms of frequency like as Eq. (7),
| (7) |
Under this condition, which is an exponent term of Eq. (2), becomes (2π/λ)(λ/16)=π/8=22.5°, Eq. (5) can be said to describe far fields on axis acoustic characteristics. Regardless of where r' is within the disk, if Eq. (6) or Eq. (7) is satisfied, the sound pressure arriving at point p on the on-axis is almost in phase, so sound pressure cancellation does not occur. Directivity, the direction characteristic of sound pressure, is calculated from Eq. (4) like as Eq. (8).
| (8) |
The direction index DI(directivity index) is as follows Eq. (9)(6,7).
| (9) |
Since it is θ = 0 on-axis, it becomes D(ω,0)=1 and thus DI(ω,0)=0 (dB).
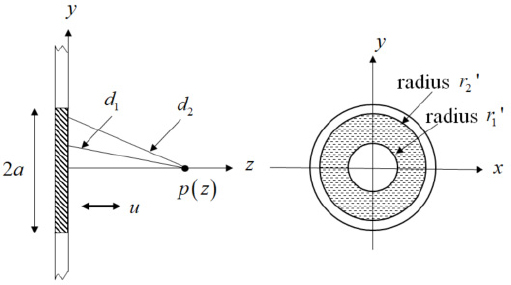
The near field sound pressure radiated by the source above the axis, the region close to the sound source where the far field approximation does not apply, is called Fresnel diffraction effects(7). Although it is not possible to obtain closed form expressions for the near field pressure at arbitrary positions radiated by an acoustic source, it is possible to obtain the on-axis near field pressure radiated by a flat circular piston on an infinite baffle. The sound pressure caused by the disk on the baffle can be calculated using Eq. (1) is obtained by integrating with respect to the disk. Follow as Fig. 2, here, and dS = 2πr'dr', and the exact on-axis solution pexact can be expressed like as Eq. (10) ~ Eq. (11)(6).
| (10) |
| (11) |
The condition for the sound pressure to be the maximum value in Eq. (11) is is followed like as Eq. (12)(7).
| (12) |
The conditions under which the sound pressure will be minimum is and given in Eq. (13).
| (13) |
The far field sound pressure is that if in Eq. (11), z/a > > 1 and are given and sinθ ≈ θ becomes θ → ϵ and , then, the approximate sound pressure in the far field is Eq. (14).
| (14) |
The ratio [%] and error of sound pressure to far field are calculated from Eq. (15) and Eq. (16).
| (15) |
| (16) |
Assuming that a disk with a radius of 0.1 m vibrates as a rigid body on an infinite baffle, the sound waves radiating from this disk below 545.9 Hz can be viewed as spherical waves. If we apply arbitrarily ϵ = 5° = π/36 in the far field sound pressure condition z/a > > ka/(4ϵ), we get z/a > > 2.85. Meanwhile, using Eq. (16), it can be seen that error between the exact axis response pexact and far field sound pressure pfar field is within 5 % is corresponding to z/a ≥ 2.2. Assume three cases in which a rigid disk with a radius of 0.1 m vibrates at 1715 Hz, 5145 Hz, and 8575 Hz, respectively. At this time, it corresponds to a = λ/2, 3λ/2, 5λ/2 for each frequency, Fresnel diffraction effects. The distance that can be considered as a far field when the disk vibrates is calculated based on Eq. (6) and r1 = 2λ = 0.4 m, r2 = 18λ = 1.2 m, r3 = 50λ = 2.0 m can be considered as the far field sound field region(6). However, if the region where the difference between the exact sound pres-sure and the far field approximate sound pressure is within 5 % is called the far field region(or area), it represents 0.26 m, 0.48 m, and 0.75 m, respectively. Meanwhile, the peak value positions can be calculated by using Eq. (12) when the exact sound pressure fluctuates according to the excitation frequency of the disk. This is shown in Fig. 3 and is summarized in Table 1. In Table 1, the meanings of 0, 0.53, and 2.4 in the 3rd column in case 3 are shown in Fig. 3. This means that the peak of the solid line (8575 Hz), which is the exact sound pressure pexact of case 3, is located at z/a = 0, 0.53 and 2.4. Looking at the 4th column of the 4th row of Table 1, when a circular disk vibrates on the baffle at a frequency of 8575 Hz and radiates sound, the distance vertically from the center of the baffle can be called the start position of the far field sound region. When predicting sound pressure in the far field sound field, it was shown that, based on Eq. (16), within 5 % error, it is possible to use the far field sound pressure approximation pfar field instead of pexact to predict sound pressure level in case of z/a > = 7.5 from farther away from the circular panel. In other words, at a location 7.5 times larger than the radius of the circular disk, the error in sound pressure is within 5 % even if the sound pressure is predicted using the far field sound pressure approximation pfar field.
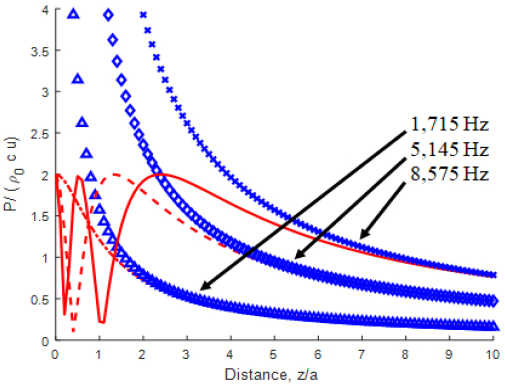
Comparison of on-axis pressure curves between pexact and pfar field for circular disk(radius = 0.1 m) on rigid baffle, vibrating frequency; pexact : 1715 Hz(dash-dot), 5145 Hz(dashed) and 8575 Hz(solid), pfar field : 1715 Hz(triangle), 5145 Hz(diamond) and 8575 Hz(x)

Comparison of far field region start position between Eq. (6) and Eq. (16) for circular disk (radius a = 0.1 m) on infinite rigid baffle
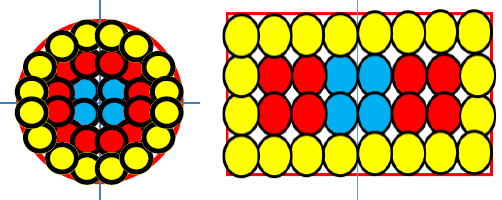
When changing the radius of the circular disk from 0.1 m to 0.05 m, it can be calculated that the sound waves radiated when the disk rigidly vibrates at frequencies of 1715 Hz, 5145 Hz, and 8575 Hz show at the far field region start of 0.1 m, 0.3 m, and 0.5 m based on Eq. (6), respectively. According to Eq. (16), it can be calculated that the radiated sound waves start at the far field region 0.11 m, 0.15 m, and 0.21 m. In terms of z/a, it is 2.2, 3.0, and 4.2, respectively. In summary, as the frequency of the circular disk vibrating as a rigid body increases, the starting position of the far field region moves away from the center of the disk. In addition, it can be seen that as the diameter of the circular disk becomes smaller, the starting position of the far field region at the same frequency becomes closer to the disk. When measuring the sound pressure in a free sound field, the total sound power can be accurately measured by surrounding the radiating object and measuring the intensity at a location where the far field sound field characteristic, where the sound pressure decreases in inverse proportion to the distance, appears. However, in the near field region, which is inside the far field region, an oscillate phenomenon of sound pressure occurs due to sound interference, Fresnel diffraction effects, making it impossible to properly measure the actual sound power radiated by the object. In LEAP® software(8), as shown in Fig. 4, the methodology of small source arrays is used to model circular and rectangular loudspeaker as small source arrays to analyze the characteristics in the near field. For example, when analyzing a woofer with diameter 15 cm, 6 small circular disks are used in the diameter direction, so the radius of the small disk is a = 0.5 inch = 0.0127 m. When the upper frequency limit of interest for the woofer’s radiated sound pressure is 3 kHz according to Eq. (16). The closest distance at which the far field approximation pfar field can be used is 0.03 m, which indicates that reliable results can be obtained even if the near field sound pressure at 3 cm or more is obtained by the far field sound pressure approximation pfar field.
2.2 Brief description of RIM
Kirchhoff-Helmholtz Integral Theorem is as followed Eq. (17) and Eq. (18)(2).
| (17) |
| (18) |
Applying the Rayleigh Integral Method on the baffle surface follow as Eq. (19),
| (19) |
where,
The sound pressure is as follows Eq. (20).
| (20) |
When calculating integral equations, there are simple source method and collocation method(9). Direct acoustic BEM can analyze the interior or exterior of a closed space. In the case of an object that is open on one side, the interior acoustic analysis is directly analyzed using acoustic internal BEM, and physical quantities are calculated at the boundary between the interior space and the open space. Using this data, we can interpret the acoustic radiation from an open space interface wall as the sound radiating from the boundary surface. In this paper, acoustic analysis was performed by using the collocation method proposed by Kirkup and developing a modified program for user convenience by linking RIM3(2), a program provided by Kirkup, with the GiD® program(1~3,9,10).
2.3 LPM
Koopmann and Fahnline presented LPM, a method to easily analyze acoustic radiation in open spaces. Koopmann et al. selected acoustic power, a scalar quantity, as a physical quantity that can characterize acoustic radiation as a design parameter for noise reduction design of structures(4). While BEM uses the element velocity boundary condition, LPM adopts the surface volume velocity as the velocity boundary condition in the Kirchhoff-Helmholtz integral equation and converts it to an average form. In this method, mathematical difficulties such as non-uniqueness that arise in acoustic BEM are eliminated by analyzing the external sound field by creating equivalent volume velocity fields using a combination of simple, dipole, and tripole sources according to boundary conditions(4). In other words, BEM uses velocity boundary conditions at elements, but LPM uses volume velocities at elements, suggesting a method to avoid non-uniqueness and non-existence problems that occur in BEM(4). In addition, the analysis time is very short compared to the BEM method, so it can be used for external acoustic radiation analysis instead of BEM(9,12). LPM is briefly described as follows. In one element, the sound pressure caused by the simple source and the dipole source is expressed as Eq. (21)(4).
| (21) |
Where,
Using Euler’s equation, the velocity in the direction at the field point x is given by Eq. (22).
| (22) |
The volume velocity across elements of the boundary surface is calculated, that is, Eq. (22) is integrated over the element surface to be analyzed. We can obtain an expression for the volume velocity as in Eq. (23).
| (23) |
After obtaining the coefficients sυ using the volume velocity boundary conditions using Eq. (23), the sound pressure at any field point can be calculated using Eq. (24).
| (24) |
Here, the constants αυ and βυ are known constant values used to represent simple, dipole, or tripole sources of acoustic radiation from each element of the structure. Table 2 shows how the source shape is determined according to the characteristics of each surface element and the constants αυ and βυ are determined accordingly(4). If the element is on the baffle, it is considered a simple source. If the element surrounds a finite volume, it is assumed to be a tripole source. In other cases, if the element is neither on the baffle nor surrounding a finite volume, it is assumed to be a dipole source(3~5,11,12).
3. Acoustic radiation analysis process
The object to be analyzed is a circular disk plate with a diameter of 0.1 m placed on an infinite rigid baffle. The thickness of the plate is 0.005 m, Young’s modulus is 105 GPa, Poisson’ ratio is 0.3, and density is 8500 kg/m3. For acoustic analysis, a program was written and used to analyze in conjunction with the GiD® system, a commercial pre-post program.
3.1 Acoustic radiation analysis using RIM
The program presented by Kirkup was slightly modified(2), and a program linked to the GiD® software was programmed and used to make it easier for users to use. A program system consisting of batch files was used to enable analysis of rigid body vibration using RIM.
RIM analysis was performed after specifying the velocities of the corresponding elements as velocity boundary conditions for the flat plate that was the subject of analysis. When RIM analysis is performed by specifying the desired analysis frequencies and field points(not meshes), the sound pressure and velocity at each frequency and each element are saved in a file, and at the same time, the sound pressure at the field points is calculated. To calculate the sound pressure pattern in a mesh composed of arbitrary field points, a new field point mesh model was created and the post program batch file programmed was used to calculate the sound pressure pattern in the field point mesh. In this case, rather than re-running the RIM program from the beginning, we used the sound pressure and velocity data files of the surface elements at each frequency for the original analysis target model, a circular disk, that had been initially calculated and saved as a file in advance. Based on these data, the sound pressure at field point meshes was calculated for new field mesh models, so analysis results were obtained in a short time.
The acoustic radiation analysis process according to flexible body vibration was carried out in the following order. Step 1: After selecting the flat plate to be analyzed on an infinite rigid baffle, velocity boundary conditions and analysis frequency range were specified. The modeling process was performed and an input file for FEM analysis was created and saved. Step 2: The previously created input file was read using a commercial FEM program. Vibration analysis was performed by inputting boundary conditions and material properties for vibration analysis in FEM. It was analyzed in the time domain using a boundary condition where the edges of the circular disk were fixed and a condition when a random force of 1 N was applied to the center of the circular disk. The random waveform was filtered using a 10 kHz low-pass filter to create a random waveform with an upper limit frequency of 10 kHz, and this was used as the 1 N random force. The acoustic elements used in the acoustic analysis were three-node triangular elements, and for vibration, six-node triangular elements were used for vibration analysis. Fig. 5 shows the vibration pattern of the instantaneous velocity magnitude at which a circular disk vibrates depending on the applied force.
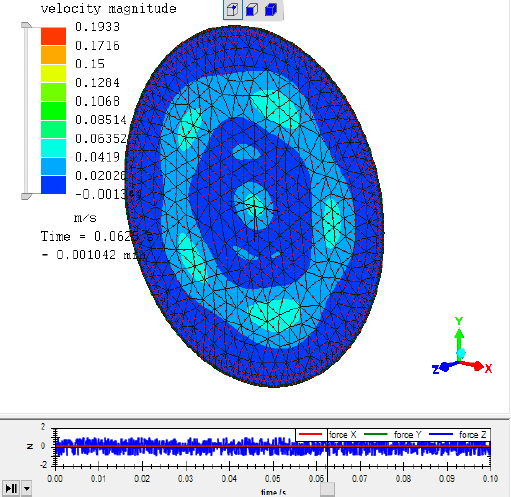
Vibration analysis on circular disk(radius = 0.1 m), fixed boundary condition, 1 N random force on center point, Δt = 9.765625E-5 s, T = 0.1 s
After vibration analysis, file written the velocity data at each node and file written the node coordinates were saved. Step 3: The time domain velocity data at each node was converted to frequency domain data using fast Fourier transform. The analysis time step was Δt = 97.65625 μs and the analysis time was 0.1 s. Therefore, the number of cases that can be analyzed ranges from 10 Hz to 5120 Hz, and vibration analysis results for 512 cases of harmonic excitation were obtained at 10 Hz intervals. It was programmed that leakage error was reduced by adopting a Hanning window when performing fft in case more data than 0.1 sec was used. Step 4: Using complex velocity data in the frequency domain at each node, the average velocity in normal direction at the centroid of the three-node triangular element, which is an acoustic element, was calculated and saved as a file. Step 5: Using the RIM program presented by Kirkup, which has been modified to have GUI (graphic user interface) characteristics so that users can use it conveniently, use velocity boundary conditions on the centroids of each element at each frequency specified in step 1. Then, RIM analysis was performed. As a result of the analysis, the sound pressure pattern on the surface to be analyzed and the sound pressure at the field points(not meshes) were calculated. In addition, in order to calculate sound pressure patterns for subsequent field point meshes, data related to sound pressure on the surface to be analyzed were saved in a file in advance. To calculate the sound pressure pattern in the new field point meshes, the field point meshes were modeled. In order to analyze acoustic characteristics in the new field point mesh, a program was written and used for post analysis. By executing this batch file, we analyzed the acoustic pattern in the field point mesh and plotted the results in GiD®.
3.2 Acoustic radiation analysis using LPM
The program used in this section was slightly modified from the program presented by Koopmann(4), and was programmed in conjunction with GiD®, a commercial program, to make it easier for users to use using a GUI. A batch file was created and used to enable analysis using LPM for rigid body vibration in a process similar to the RIM analysis process. For the flexible body vibration analysis, another batch file was created, and acoustic analysis was performed using LPM using these batch files(5). We programmed a post program, batch file that can calculate and plot the LPM analysis results on field point meshes, and using this, we were able to obtain sound pressure pattern results on field point meshes.
Acoustic radiation analysis due to rigid body vibration was performed by creating a batch file similar to the RIM analysis. LPM analysis was performed after specifying the velocities of the corresponding elements as the velocity boundary conditions of the plate that was the subject of analysis. By specifying arbitrary desired analysis frequencies and field points, the sound pressure and velocity at each element at each frequency were stored in a file, and at the same time, the sound pressure at the field points was calculated. The difference from the RIM program is that RIM uses velocity boundary conditions, while LPM uses the volume velocity of elements as the boundary condition(4). Step 1: Model the LPM analysis target with GiD® and specify the velocity at the element as the velocity boundary condition. If an element is on an infinite rigid baffle, a boundary condition was specified at the modeling stage to determine whether it was an element surrounding a finite volume, or whether it was an element that was not on an infinite baffle and did not surround a finite volume. Step 2: Run the preceding program of the LPM program to calculate the volume velocity of each element using the velocity data from each already specified element and save it as a file. Step 3: Acoustic analysis was performed by running the LPM program. At this time, sound pressure at designated field points was also calculated. The surface data of each element at each frequency and the data required for calculations in other field point meshes were saved as a file.
The analysis was performed in a process similar to the RIM analysis process. A new field point mesh model was created and a batch file for post analysis was created and used. Acoustic patterns in field point meshes could be calculated. In this case, rather than re-running the LPM program from the beginning, the file containing the sound pressure and velocity data of the surface elements at each frequency, which had been saved in advance after initially calculating it, was read and used for subsequent calculations.
4. Acoustic radiation simulation and discussions
4.1 Comparison of acoustic radiation according to rigid body vibration of a disk
It was assumed that a circular disk with a diameter of 0.1 m was placed on an infinite baffle. The sound pressure radiated when a rigid body vibrates at 1 m/s was compared with the near field sound pressure, the far field sound pressure, and the results of the RIM. The sound pressure was calculated at 100 field points locations at 0.01 m intervals at z = 0.01 m in the normal direction from the center of the circular disk. The analyzed frequencies were 1715 Hz and 8575 Hz. Analysis was performed for four cases depending on the size of the elements used. Looking at Fig. 6, the first column showed the sound pressure when a disk with radius a = 0.1 m was vibrating at 1715 Hz, 1 m/s, and moving away from the center of the disk in the normal direction. Comparing the results analyzed by and RIM in all four cases described in Table 3 (Fig. 6(a)), it was shown that the error was within 5 % in all four cases compared to pexact. Fig. 6(b), the second column of Fig. 6, compares the radiated sound pressure calculated by RIM, pexact and pfar field when the disk vibrates at a frequency of 8575 Hz. The first figure showed case 1 in Table 3, which was the result of modeling a circular panel with 16 elements and analyzing it with RIM. The RIM results showed an error of up to 114.14 % when compared to pexact. A dip phenomenon in sound pressure occurred near z/a = 1 (z = 0.1 m), and the maximum error occurred at this point. However, overall, the RIM analysis results were in good agreements with the exact pressure pexact. Case 1 represents a desirable frequency limit of up to 583 Hz if the 1/6 rule of the wavelength is followed, and if the 1/3 rule is followed, the upper frequency limit that can be interpreted is up to 1166 Hz. However, even when the on-axis sound pressure was 8575 Hz, the RIM analysis results showed good agreement with the exact solution when z/a is greater than 1. As the error decreased as the element size decreased, RIM passed the convergence test.
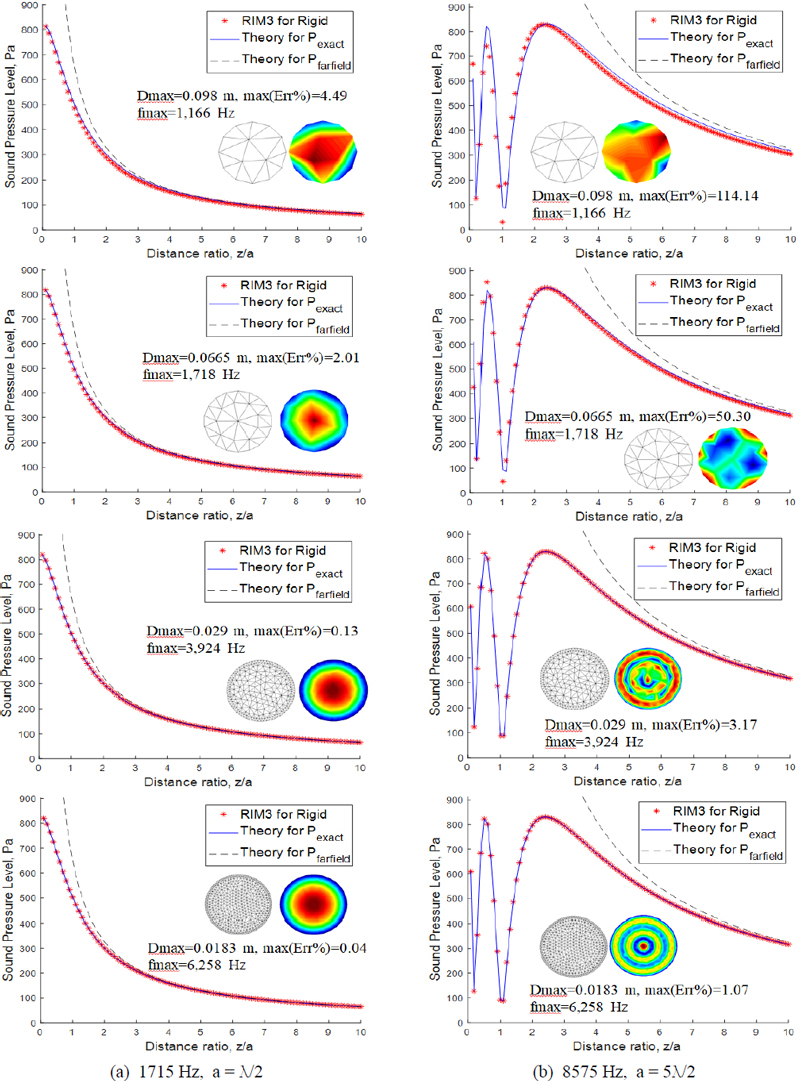
Comparison of pexact, pfar field and Pressure by RIM, circular disk(radius a = 0.1 m) on infinite baffle, max(Err%) = max(|(RIM-pexact)/pexact|) × 100, rigid body velocity(1 m/s) B.C., zrange = 0.01 m ~ 1 m, interval = 0.01 m

Comparison of max(Err%) of beam pattern between RIM and LPM in case of circular disk(radius = 0.1 m) on rigid baffle corresponding to three frequencies, 1715 Hz, 3430 Hz, 8575 Hz
Figure 7 showed the results calculated by LPM. The first column in Fig. 7 is shown in Fig. 7(a), which is the 1715 Hz case. Cases 1 and 2 in Table 3 correspond to the first and second figures above, and the maximum error between the LPM analysis result and the exact solution was about 6 %. The location where the maximum error occurred was 0.01 m in front of the circular disk. The second column, Fig. 7(b) is the result of comparing the sound pressure radiated from a disk vibrating at 8575 Hz. Unlike the RIM analysis results, the LPM analysis showed large errors. It was shown that errors in the near field can be greatly reduced only when a circular disk is modeled with an element size that satisfies the 1/3 rule. As the error decreased as the element size decreased, LPM passed the convergence test. Table 3 showed the errors of LPM compared to RIM in four modeling cases. It was found that at least the elements must be modeled using the 1/3 rule to ensure that the error in the near field is within about 5 %.
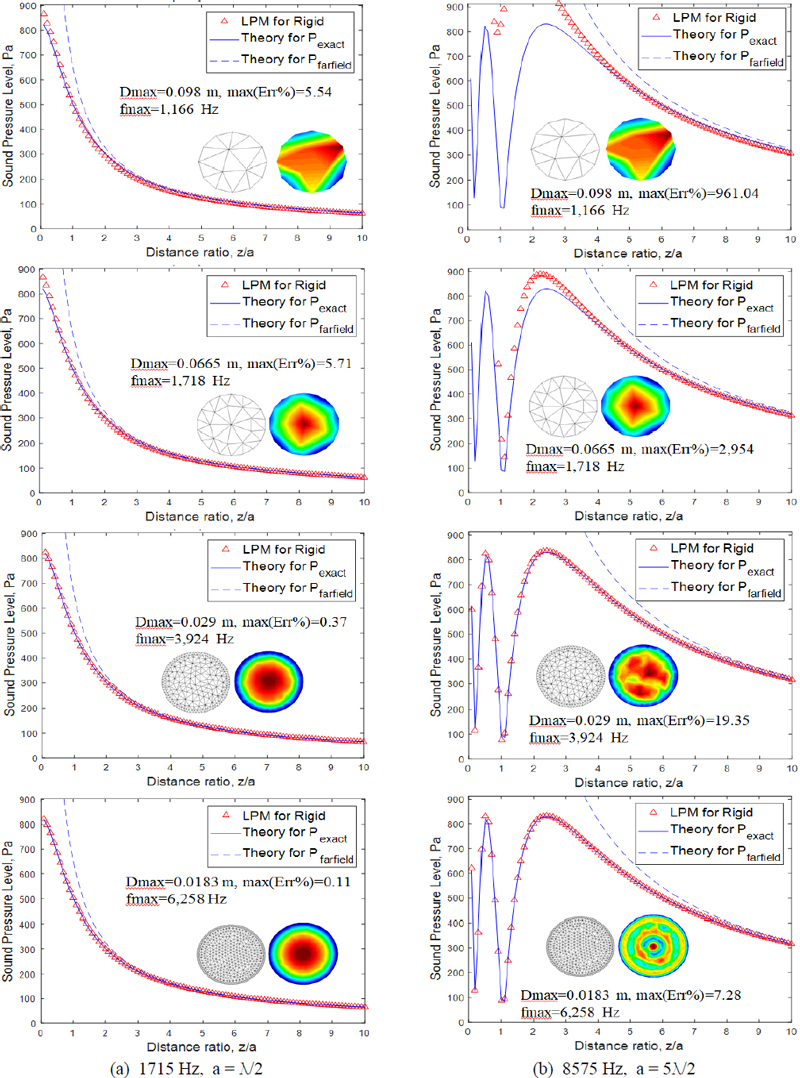
Comparison of pexact, pfar field and Pressure by LPM, circular disk(radius a = 0.1 m) on infinite baffle, max(Err%) = max(|(RIM-pexact)/pexact|) × 100, rigid body velocity(1 m/s) boundary condition, zrange = 0.01 m~ 1 m, interval = 0.01 m
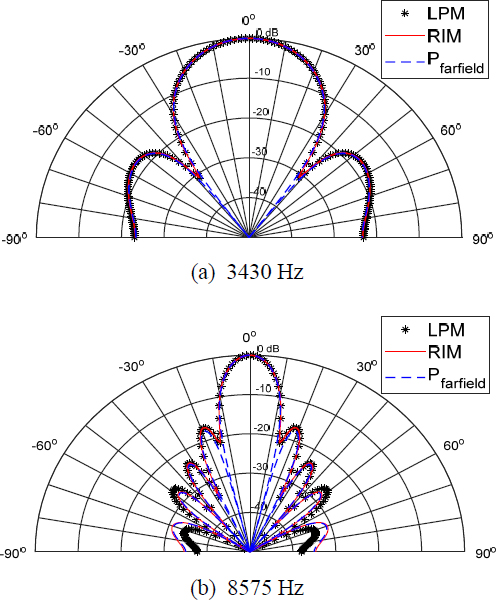
Figure 8 compares the direction index DI, which is the beam pattern of far field sound pressure pfarfield, LPM and RIM, for case 2 in Table 3. In case 2, according to the 1/3 wavelength rule, up to 1718 Hz is the upper frequency limit for reliable analysis. In the case of RIM, it was shown to match well with the beam pattern of far field sound pressure even at 3430 Hz and 8575 Hz, which are frequencies exceeding the upper analysis limit frequency. However, in the case of LPM analysis, in the case of 3430 Hz (Fig. 8(a)), a large error occurred above 40° based on the axis, and in the case of 8575 Hz, a large error occurred above 30°. When the size of the element was larger than the 1/3 wavelength rule, the beam pattern analyzed by LPM was inaccurate. On the other hand, the RIM method showed that the beam pattern matched well with the theoretical value even though it was modeled with elements larger than 1/3 wavelength rule.
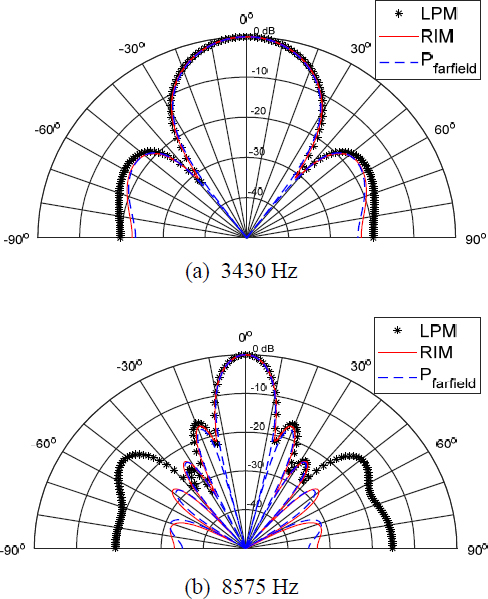
Comparion of beam pattern between RIM and LPM and pfar field in case of circular disk for case 2, 0° means z-axis, rigid body vibration, at radius = 1 m
Figure 9 shows the beam pattern for case 3 in Table 3. According to the 1/3 wavelength rule, the upper frequency limit for analysis was up to 3924 Hz. In Fig. 9(a), both LPM and RIM showed that the beam pattern matched well with the theoretical value. In the case of 8575 Hz, Fig. 9(b), which exceeds the upper analysis limit frequency, the RIM method showed better agreement with the theoretical beam pattern than that obtained by the LPM method.
4.2 Comparison of acoustic radiation according to the flexible vibration of the disk
The sound pressure radiated when a circular disk placed on an infinite rigid baffle vibrates under a random force of 1 N at the center with the edge fixed was analyzed using RIM and LPM methods. Fig. 10 is for case 4 in Table 3 According to the 1/3 wavelength rule, the upper analysis limit frequency was 6258 Hz. When excited at 3430 Hz, the maximum error in sound pressure as LPM compared to RIM was 2.7 %. Since almost identical results were obtained with the LPM and RIM analysis methods, both analysis methods could be said to be useful in the case of a circular disk placed on a baffle surface.
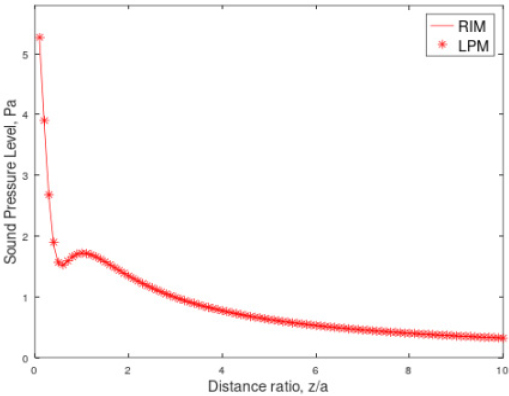
Comparison of Pressure between RIM and LPM, circular disk(radius a = 0.1 m) on infinite baffle, max(Err%) = max(|(LPM-RIM)/RIM|) × 100 = 2.7 %, case 4, at 3430 Hz, flexible random vibration excited on circular disk center by 1 N force, zrange = 0.01 m ~ 1 m, interval = 0.01 m
Figure 11 shows the result of calculating the beam pattern in a circular disk vibrating at 3430 Hz using RIM and LPM, and the maximum error of LPM compared to RIM was 15.7 % around 60° offset on the axis. The reason why the error appeared larger than it appeared was around the dip, where the level of sound pressure was very small, so even a small difference in sound pressure level resulted in a large error.
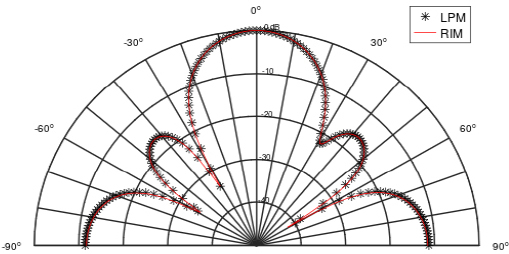
Comparison of Pressure beam pattern between RIM and LPM, circular disk(radius a = 0.1 m) on infinite baffle, max(Err%) = max(|(LPM-RIM)/RIM|) × 100 = 15.7 % at 60°, case 4, at 3430 Hz, flexible random vibration excited by 1 N random force at center of circular disk, fixed boundary condition.
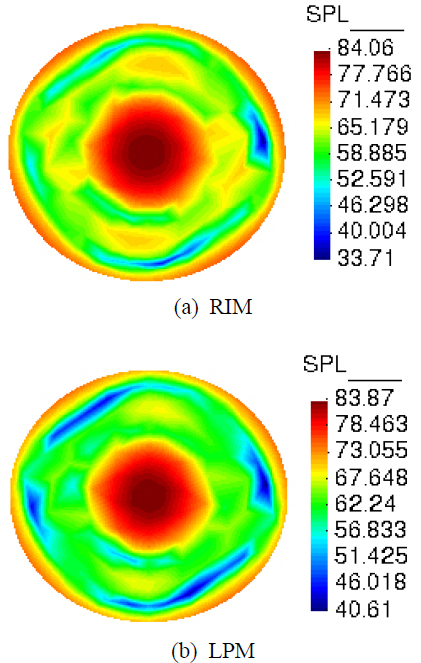
Figure 12 compares the sound pressure pattern on the surface of a hemisphere (radius 1 m, center, 0,0,0) due to the radiated sound generated from the circular disk modeled as case 4 in Table 3. The maximum sound pressure difference between RIM and LPM was 0.19 dB. It was shown that almost the same results can be obtained using RIM and LPM, which used volume velocity boundary conditions.
5. Conclusion
The sound pressures on the axis normal to the center of the circular disk, which are generated when the circular disk lies on the surface of the rigid baffle and the circular disk vibrated as a rigid body, are calculated. (1) Using pexact, which is the theoretical sound pressure prediction result on the axis, and pfarfield, which is the far field sound pressure approximation, it was shown that the location where the far field sound field characteristics start can be theoretically predicted depending on the size of the circular disk. (2) It was found that the starting position of the far field sound region moves further away from the center of the disk as the frequency increases. (3) It was also shown that when the size of the rigid radiator source decreases, the starting position of the far field sound field begins closer to the center of the disk. (4) The sound pressure prediction results on the axis showed that the RIM case was closer to pexact better than the LPM. When a circular disk with a radius of 0.1 m was modeled as an element satisfying the 1/3 wavelength rule, the results of RIM and LPM analysis showed that the error with was within 0.5 % even in the near field with z/a = 0.01. Therefore, it was found that near field analysis was possible to predict using LPM and RIM analysis. (5) The acoustic beam pattern at a far field showed that RIM was more consistent with the far field sound pressure approximation pfarfield, theoretical value than LPM when using large elements that did not satisfy the 1/3 wavelength rule. Therefore, it was found that RIM can be a more efficient analysis method than LPM when calculating total sound power rather than sound pressure. However, when elements satisfying the 1/3 wavelength rule were used, the LPM and RIM analysis results were almost identical ones. (6) The acoustic radiation generated when a circular disk placed on a baffle vibrates as a flexible body was analyzed using LPM and RIM. As a result of the analysis at 3430 Hz, when modeled with element sizes that follows the 1/3 wavelength rule, the position where the maximum error between the two methods occurred for the sound pressure on the axis was z/a = 0.01, which was 1 % of the radius of the circular disk. It occurred in the maximum error size was 2.7 %, indicating very good agreements between the LPM and RIM results. (7) Discussing on the analysis results using field point meshes, a hemisphere with a radius of 1 m, the sound pressure radiated from a circular disk at hemisphere center with element sizes that satisfies the 1/3 wavelength rule showed similar patterns on LPM and RIM results. The maximum difference in maximum sound pressure was shown to be less than 0.2 dB. Therefore, it was found that by modeling with elements that follow the 1/3 wavelength rule, the analysis of acoustic radiation caused by flexible vibration can be accurately predicted at near and far field using either LPM or RIM. (8) When predicting sound power by measuring or numerically calculating the sound pressure for a specific frequency, the sound pressure must be obtained at a distance greater than or equal to the distance where the far field of the radiator begins. The start position of the far-field sound field according to frequency is described. (9) The LPM was also shown to be valid for predicting near field and far field sound pressure if used to follow the 1/3 wavelength rule. (10) As the error decreased as the element size decreased, it showed that RIM and LPM passed the convergence test.
Acknowledgments
This paper discusses the content presented at the Autumn Conference of the Korean Society for Noise and Vibration Engineering in October 2019. Special thanks to Enrique Escolano from GiD® for providing technical support, including the layered display method showing the analysis results of BEM or LPM models and the results of the field mesh model simultaneously. This method was utilized in reference 5. Additionally, gratitude to Victor Kemp from Mecway® for offering technical support in interfacing Mecway® FEA with the Helm3d program in GiD®.
References
-
Kirkup, S. M., 1994, Computational Solution of the Acoustic Field Surrounding a Baffled Panel by the Rayleigh Integral Method, Applied Mathematical Modelling, Vol. 18, No. 7, pp. 403~407.
[https://doi.org/10.1016/0307-904X(94)90227-5]

- Kirkup, S., 1999, Computing the Acoustic Field Surrounding a Baffled Plate by the Rayleigh Integral Method, Manual for Fortran Subroutine RIM3.
- Park, S.-T., 2019, Comparison of Acoustic Radiation Analysis Method by Plate Vibration on Infinite Baffle, Proceedings of the KSNVE Annual Autumn Conference, p. 150.
- Koopmann, G. H. and Fahnline, J. B., 1997, Designing Quiet Structures: A Sound Power Minimization Approach, Academic Press, San Diego, United States.
- Park, S.-T., 2023, Acoustic Radiation Analysis by a Vibrating Surface in a Cuboid Box, Journal of Chungbuk Health & Science University, Vol. 32, pp. 33~60.
- Leach, W. M. Jr., 2003, Introduction to Electroacoustics & Audio Amplifier Design, 3rd Edition, Kendall/Hunt Publishing Company, Dubuque, IA, United States.
- Kinsler, L. E., Frey, A. R., Coppens, A. B. and Sanders, J. V., 2000, Fundamentals of Acoustics, 4th Edition, John Wiley & Sons, NY, United States.
- LinearX Systems, 2002, LEAP Enclosure Shop Reference Manual, LinearX Systems Incorporation, Release 5.
-
Herrin, D. W., Martinus, F., Wu, T. W. and Seybert, A. F., 2003, A New Look at the High Frequency Boundary Element and Rayleigh Integral Approximations, SAE Technical Paper 2003-01-1451.
[https://doi.org/10.4271/2003-01-1451]

-
Kirkup, S. M., Thomson, A., Kolbrek, B. and Yazdani, J., 2013, Simulation of the Acoustic Field of a Horn Loudspeaker by the Boundary Element-rayleigh Integral Method, Journal of Computational Acoustics, Vol. 21, No. 1, 1250020.
[https://doi.org/10.1142/S0218396X12500208]

-
Fahnline, J. B. and Koopmann, G. H., 1997, Numerical Implementation of the Lumped Parameter Model for the Acoustic Power Output of a Vibrating Structure, The Journal of the Acoustical Society of America, Vol. 102, No. 1, pp. 179~192.
[https://doi.org/10.1121/1.419781]

- Morgans, R. C., 2005, Optimisation Techniques for Horn Loaded Loudspeakers, Doctoral Dissertation, The University of Adelaide, Adelaide, Australia.

Seok-Tae Park B.S. in Hanyang University, Mechanical Eng., 1984., M.S. in KAIST, Mechanical Eng., 1986., Ph.D. in Ajou University, Systems Eng., 1999. 1986 ~ 1989., KAIST(KIST) Mechanical Eng., researcher. 1989 ~ 1992., Ssangyong Motor Co., senior researcher. 1993 ~ 1999., IAE Automotive Technical Lab. principal researcher. 2000 ~ present, assistant professor of Electrical Eng. in Chungbuk Health & Science University. His principal interest is the fields of sound quality index codes programming, noise control, and subjective evaluation, loudspeaker, horn and microspeaker system analysis and design, boundary integral analysis in Acoustics.
